
Gains in productivity have fueled the growth in U.S. agricultural output
- by Sun Ling Wang
- 5/11/2017
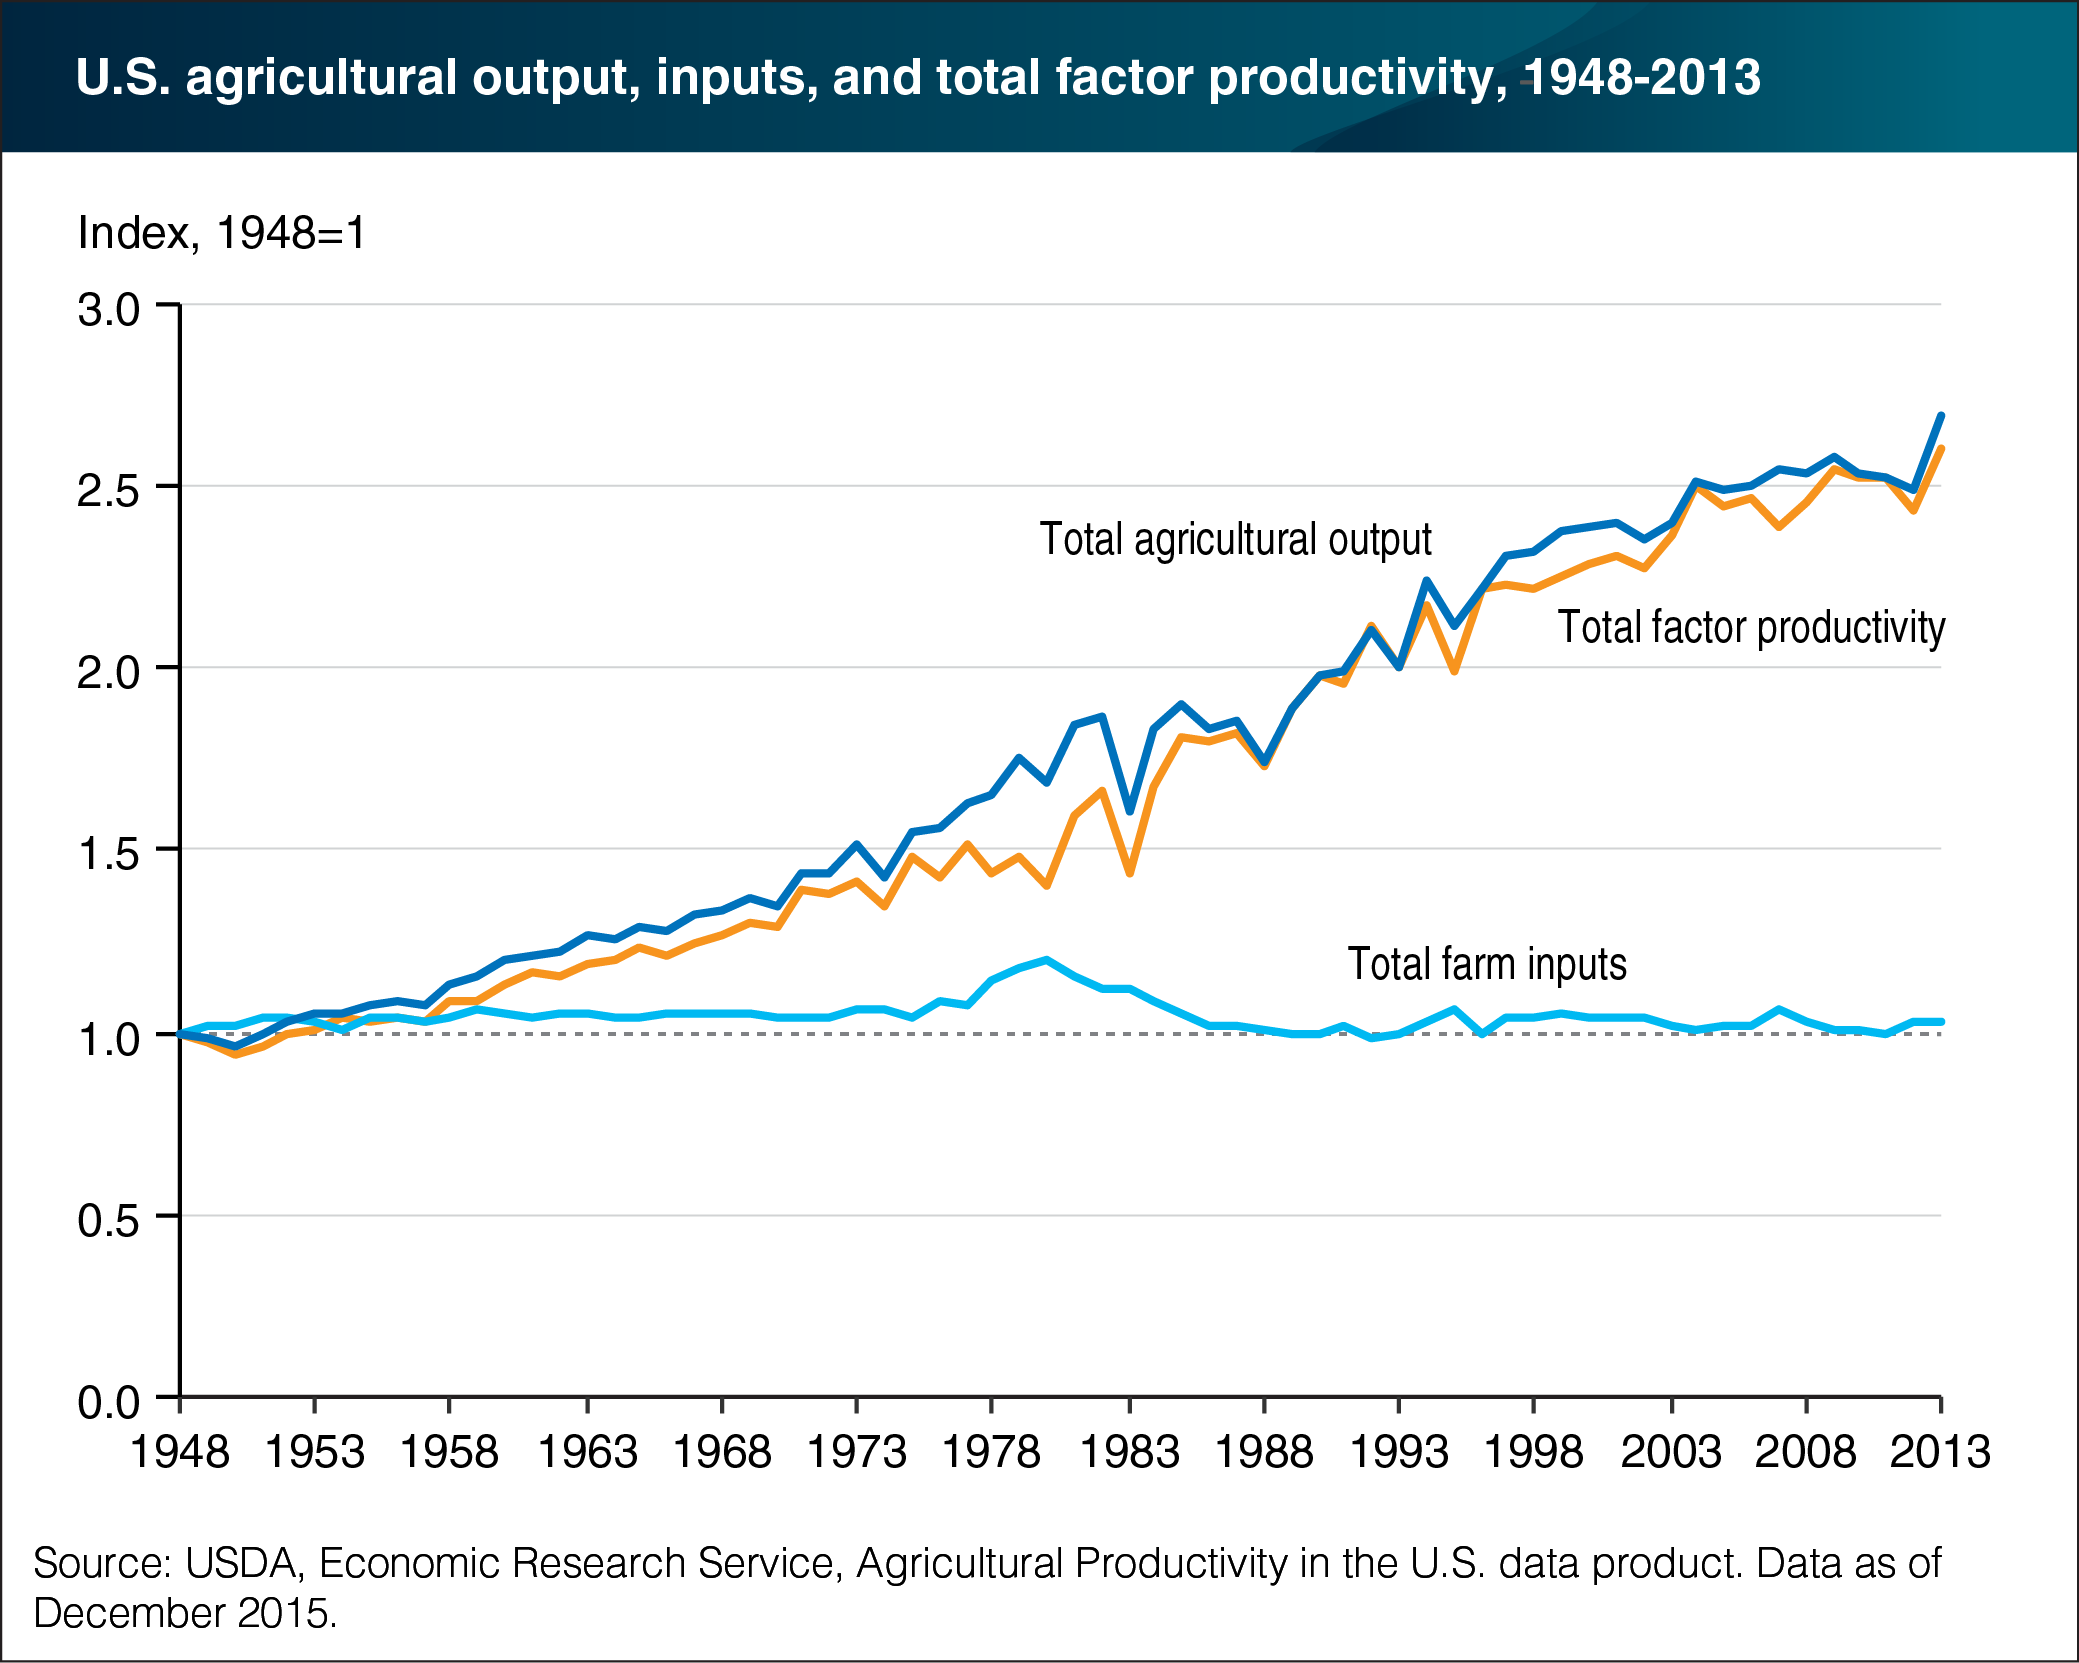
From 1948 to 2013, U.S. farm sector output grew by 170 percent with about the same level of farm input use over the period. This output growth resulted mainly from gains in productivity, as measured by total factor productivity (TFP)—the difference between the growth of aggregate output and growth of aggregate inputs (such as land and labor). Between 1948 and 2013, total output grew at an average annual rate of 1.52 percent, agricultural TFP at 1.47 percent, and input use at only 0.05 percent. Long-term agricultural productivity is fueled by innovations in animal/crop genetics, chemicals, equipment, and farm organization that result from public and private research and development. This chart appears in the ERS publication Selected charts from Ag and Food Statistics: Charting the Essentials, 2017, released April 28, 2017.