
Gains in productivity drive growth in U.S. agricultural output
- by Sun Ling Wang
- 9/14/2016
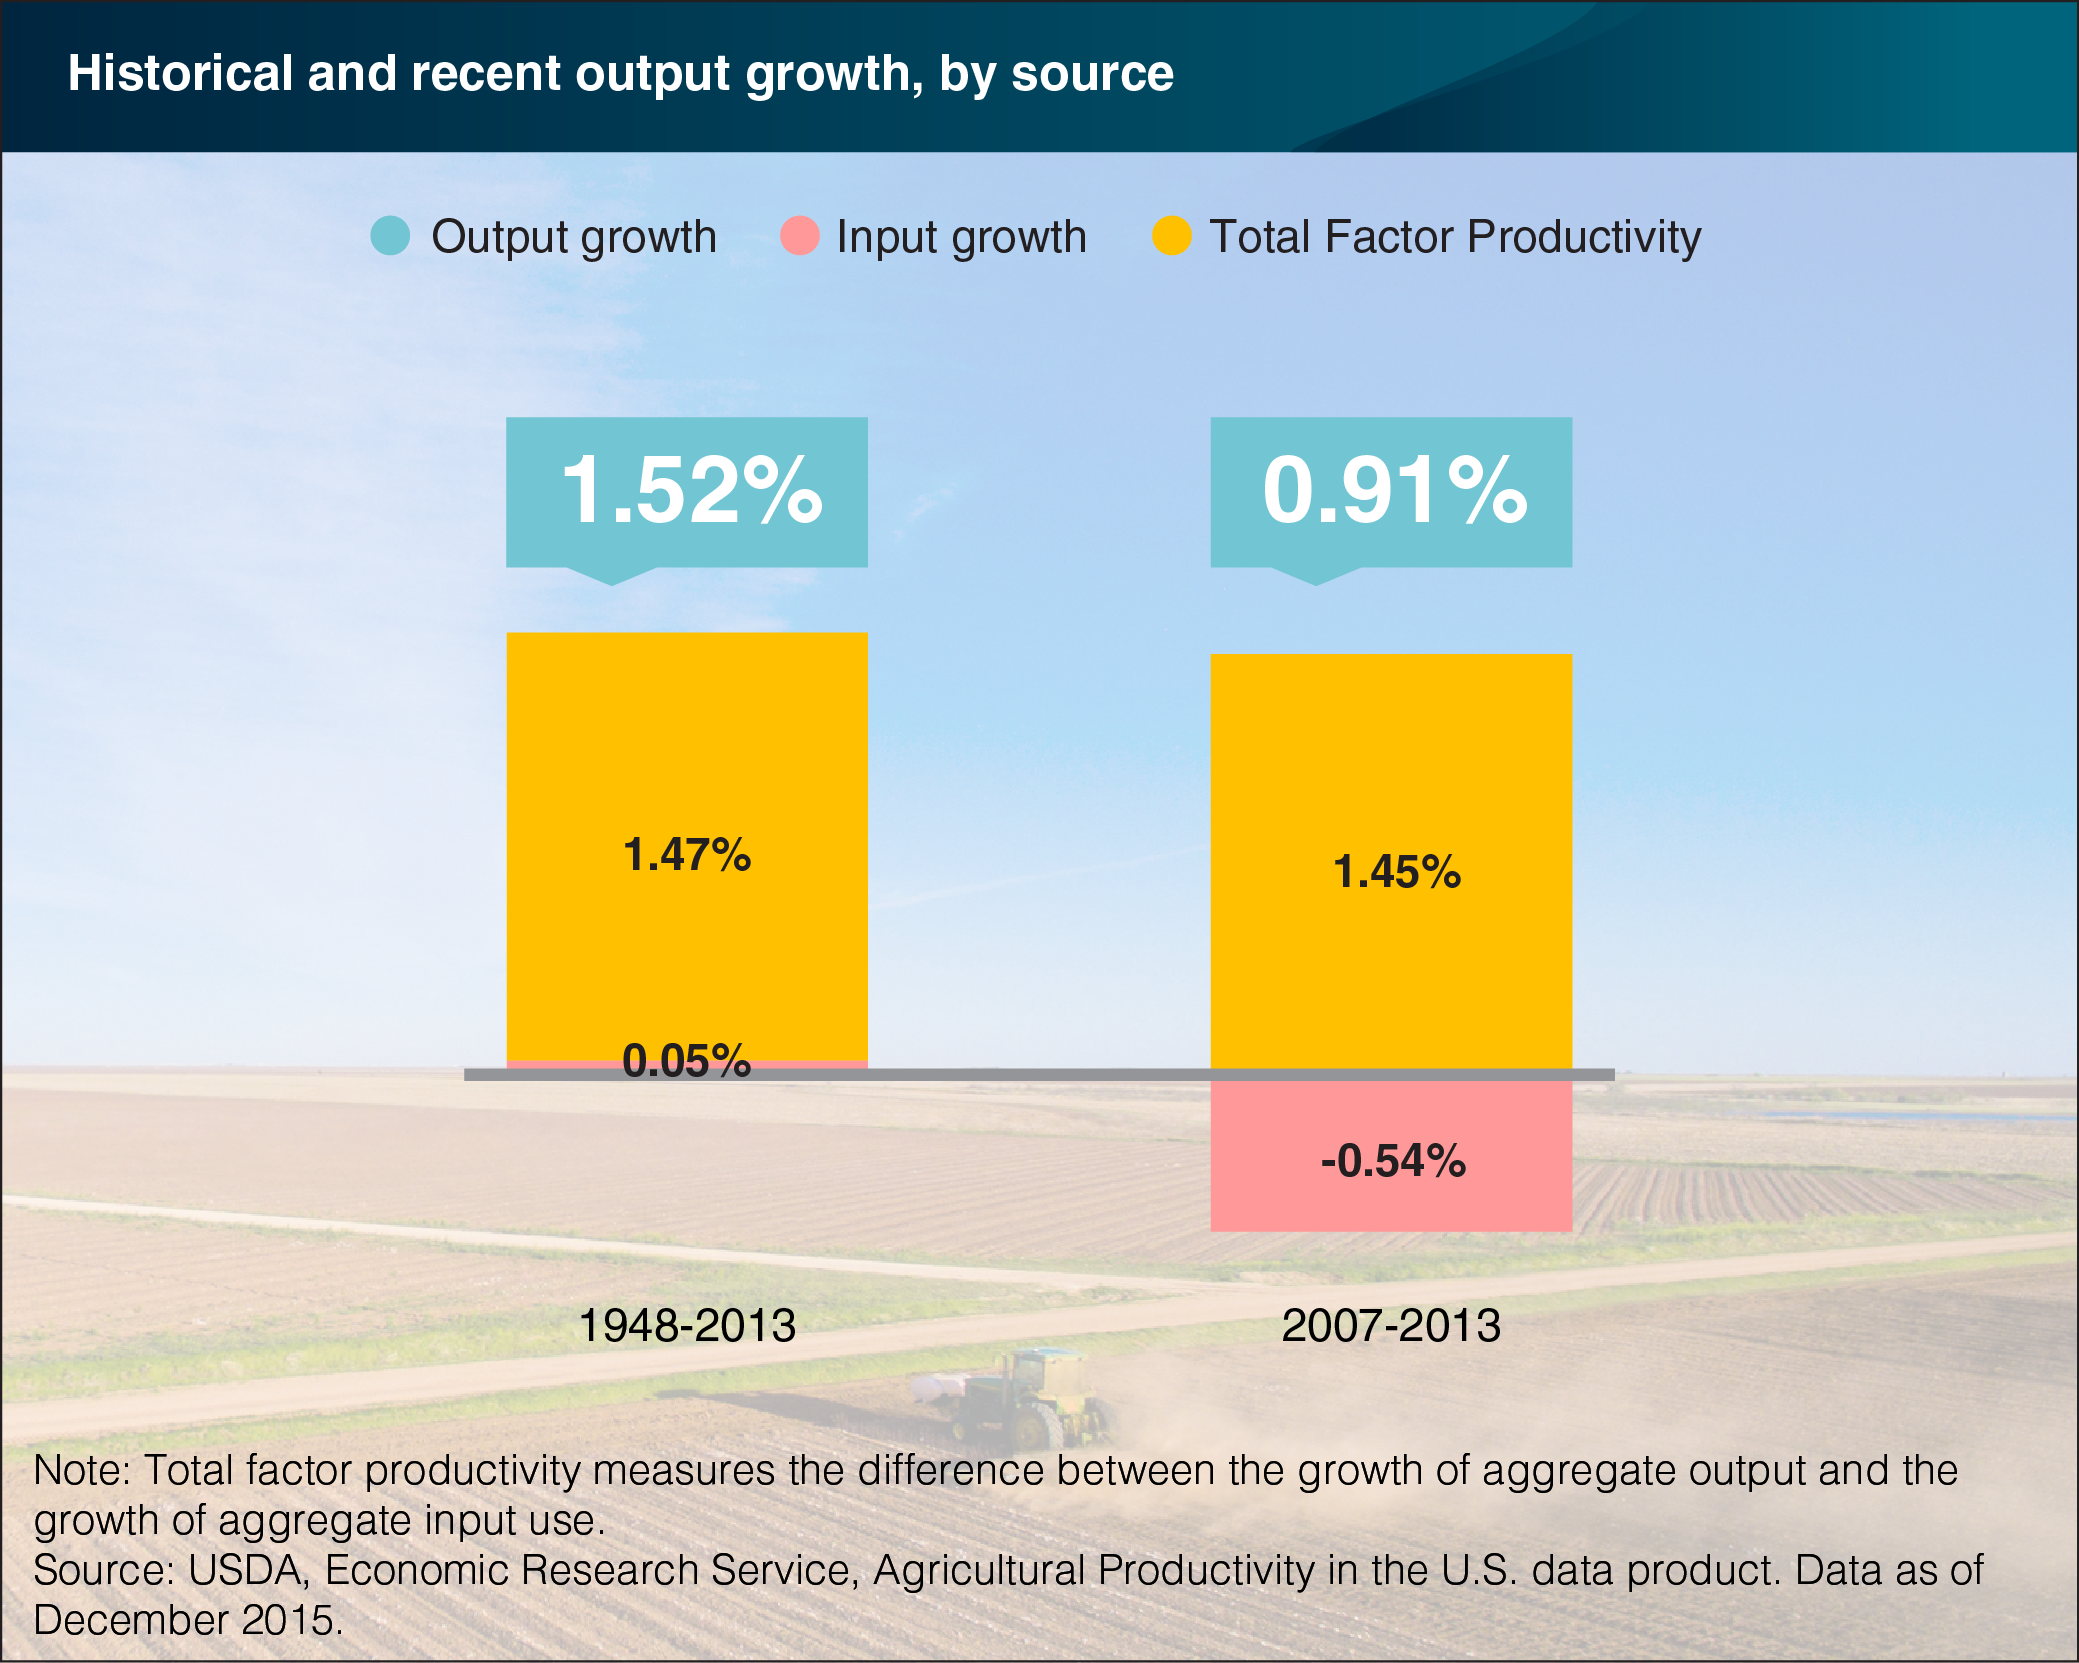
U.S. agricultural output more than doubled between 1948 and 2013, growing on average at 1.52 percent annually. Total input use (for example, land, labor and materials such as seed and feed) grew at only 0.05 percent per year on average. Improvements in how efficiently inputs are transformed into outputs, known as Total Factor Productivity (TFP), fueled almost all of the output growth. Advancements in technology—such as improvements to machinery, seeds, and farm structures—enabled agricultural TFP to grow an average of 1.47 percent annually. This rate exceeded the productivity growth of most U.S. industries, according to data from the U.S. Bureau of Labor Statistics. In recent years, between 2007 and 2013, TFP growth has kept up with its historic rate. This strong productivity growth has offset the decline in the use of agricultural inputs, allowing agricultural output to continue to grow by 0.91 percent annually. A version of this chart is found in the September 2016 Amber Waves feature, "Productivity Growth Is Still the Major Driver in Growing U.S. Agricultural Output".