
First period of decline in U.S. rural population may be ending
- by John Cromartie
- 4/28/2016
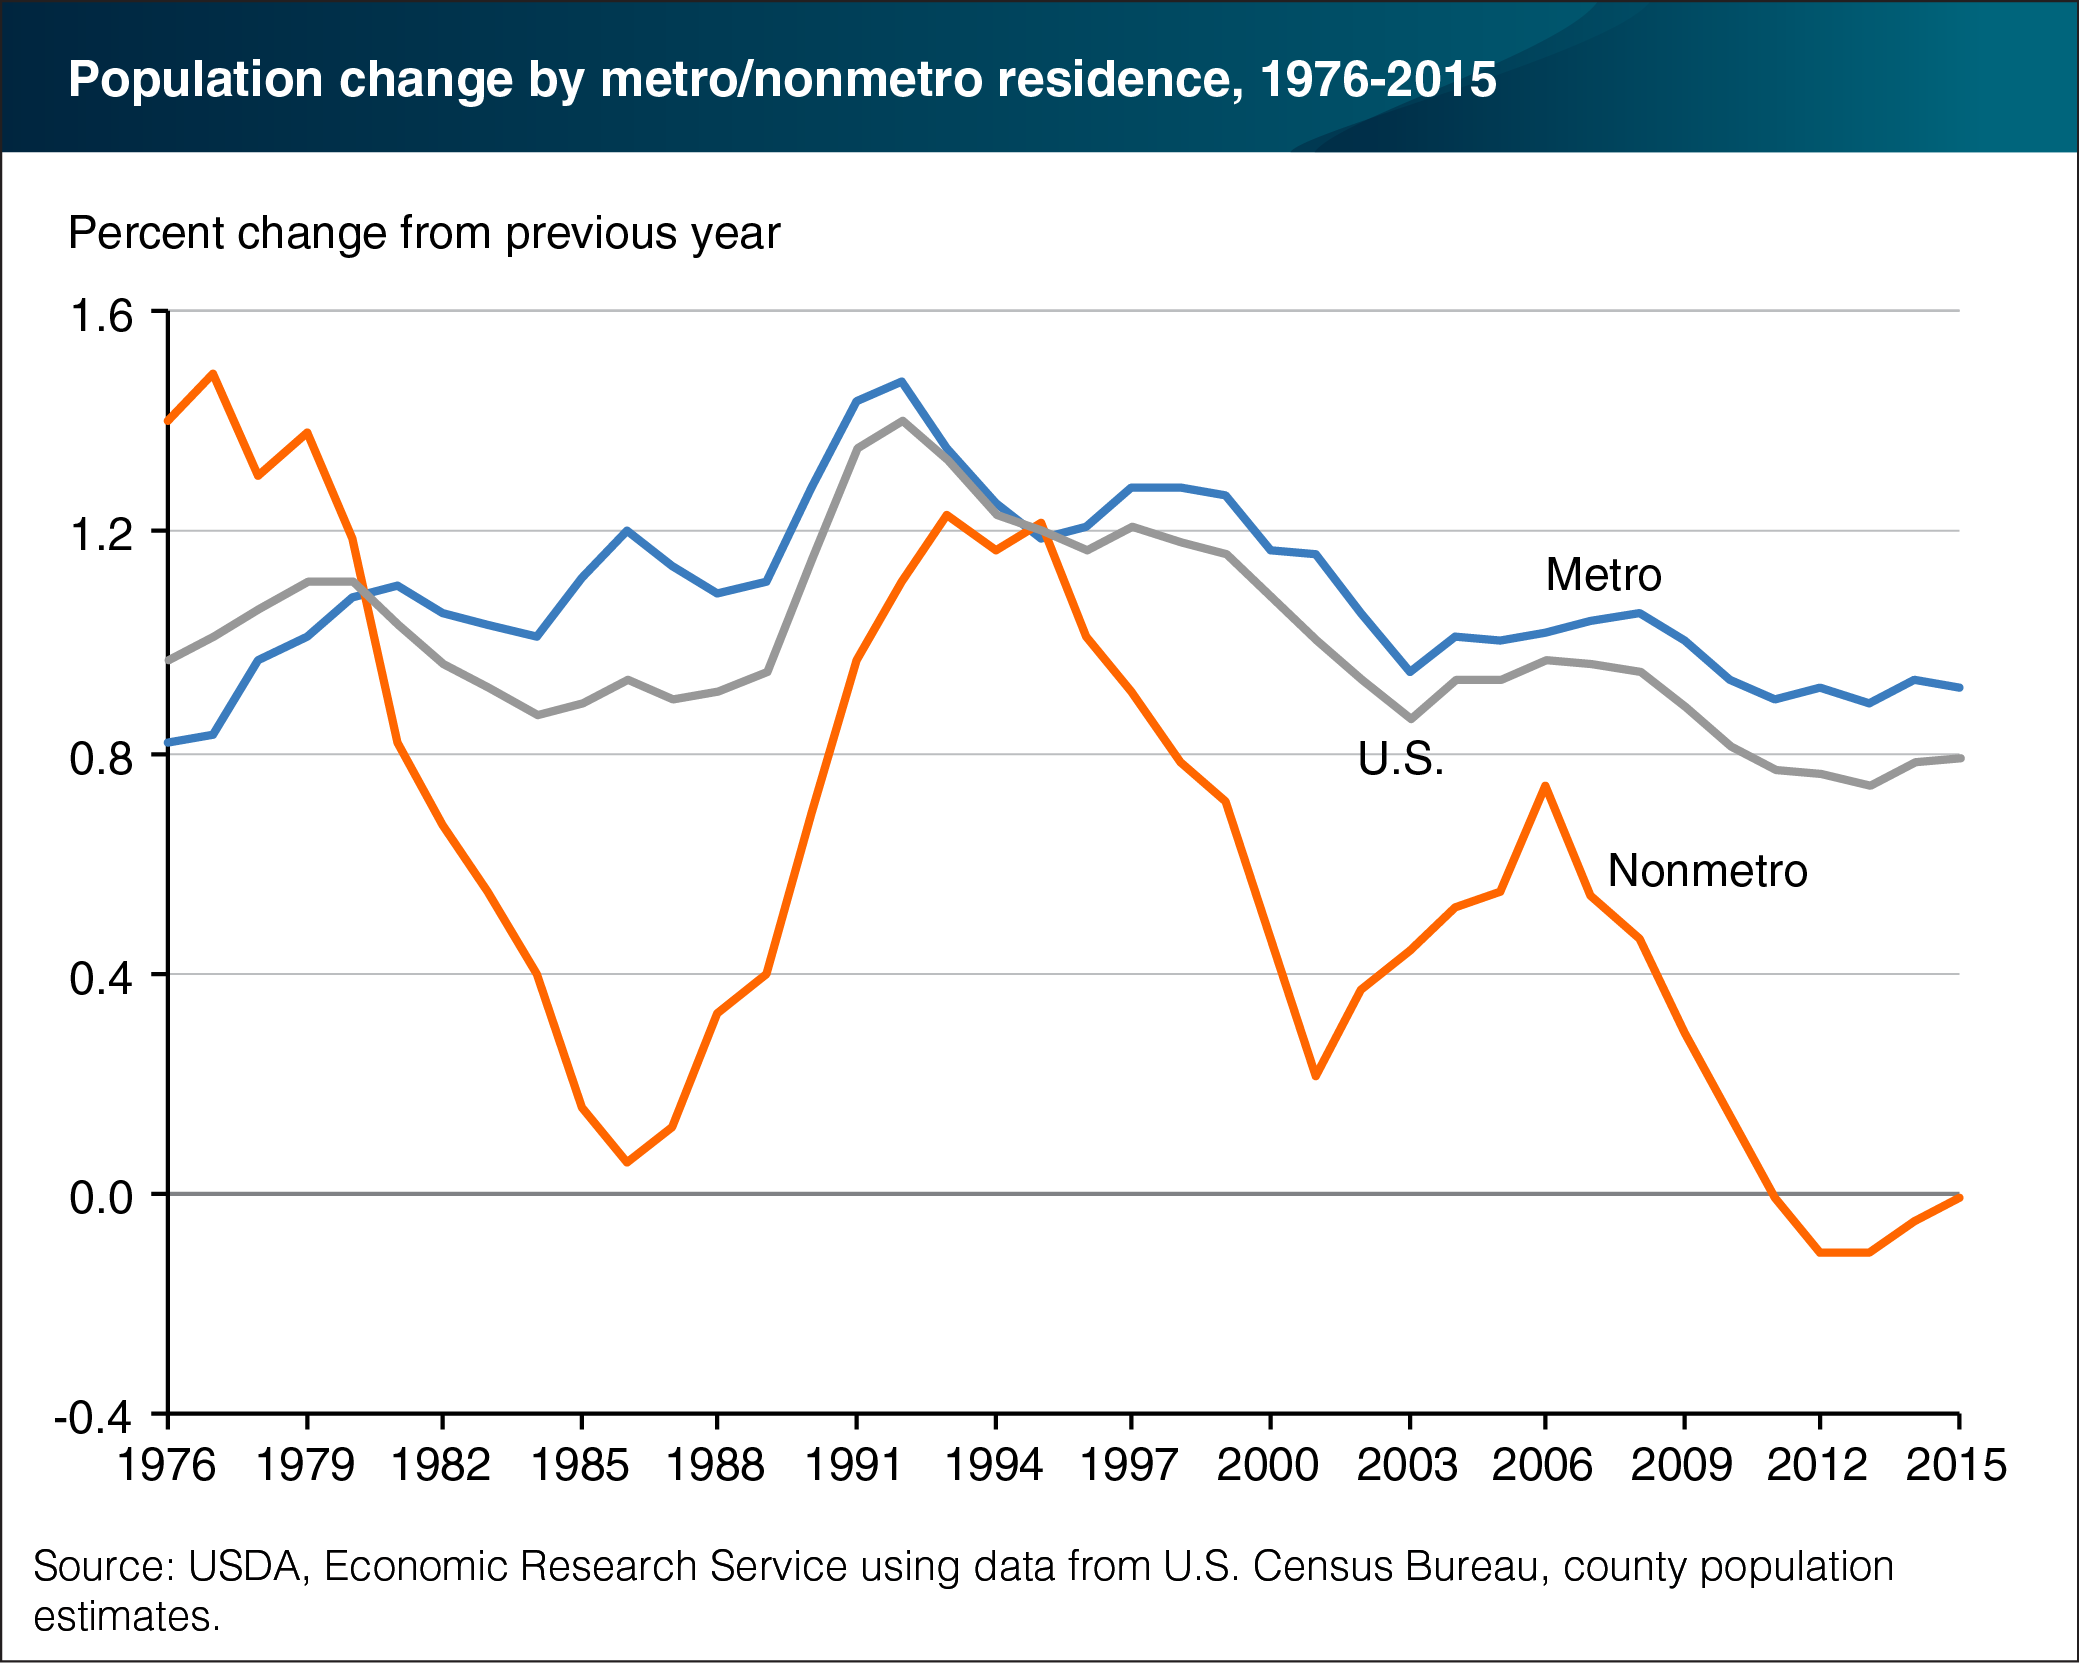
The total number of people living in rural (nonmetropolitan) counties remained essentially unchanged between July 2014 and July 2015, after 4 years of modest population losses. The 2014-15 improvement in rural population change coincides with an improvement in rural employment growth and suggests that this first-ever period of overall population decline (from 2010 to 2015) may be ending. Rural population change is the result of two components: net migration (the difference between the number of people moving into and out of rural counties) and natural increase (the difference between the number of births and deaths). Both components have contributed to the loss in rural population since 2010. A sharp, cyclical downturn in net migration, beginning with the housing market collapse in 2007, appears to have bottomed out in 2012. The Great Recession (December 2007-June 2009) also contributed to a downturn in natural increase, as fewer births occur during times of economic uncertainty. Falling birth rates and an aging population have steadily reduced population growth from natural increase in rural counties over time, increasing the chances of overall rural population decline in the future. This chart appears in ERS’s Ag and Food Statistics: Charting the Essentials data product, updated March 24, 2016.