
No-till and strip-till were widely used —although not predominantly— on U.S. crop acres in 2010-11
- by Tara Wade and Roger Claassen
- 1/19/2016
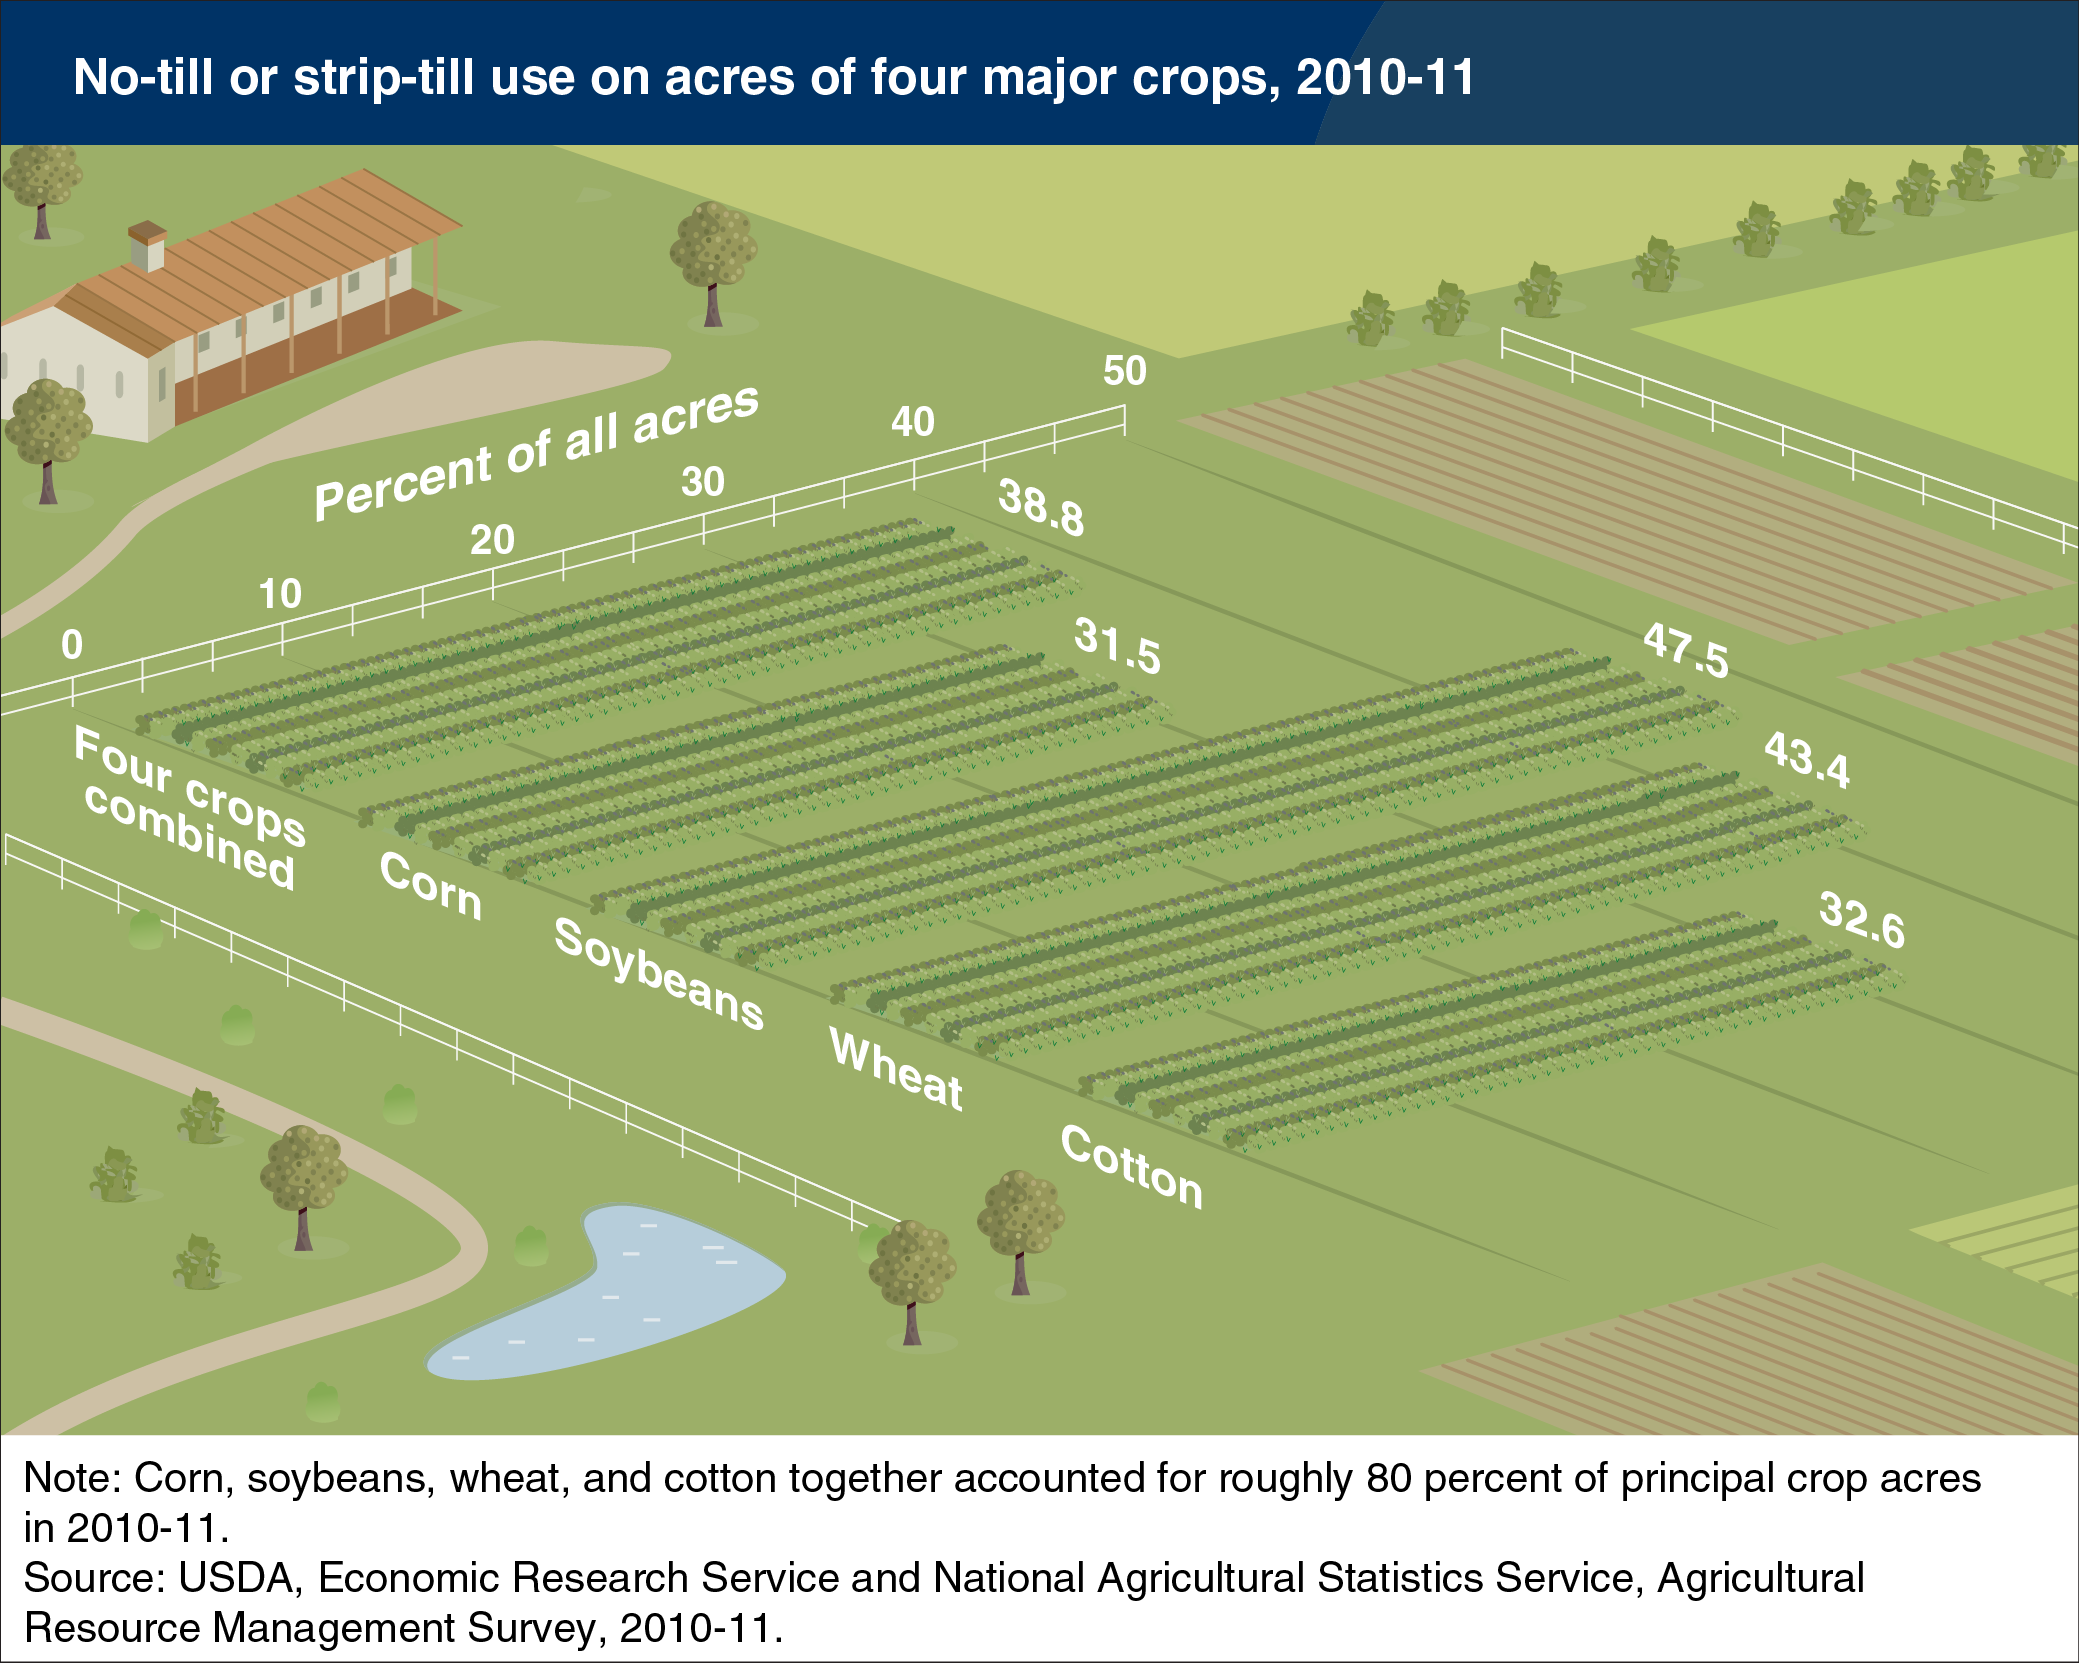
No-till and strip-till are two of several tillage methods farmers use to plant crops. These practices disturb the soil less than other methods, reducing soil erosion, helping maintain soil carbon, and can contribute to improved soil health. In a no-till system, farmers plant directly into the undisturbed residue of the previous crop without tillage, except for nutrient injection; in a strip-till system, only a narrow strip is tilled where row-crops are planted. Overall, 39 percent of the combined corn, soybean, wheat, and cotton acres (the four most widely grown crops in the U.S.) were in no-till/strip-till in 2010-11 (89 million acres per year), with adoption rates higher for some crops. Farmers may be more likely to use no-till/strip-till on crops that are thought to be well suited for the practices (e.g., soybeans) and more likely to use conventional tillage or other conservation tillage methods for crops where no-till/strip-till management is perceived as more risky (e.g., corn). Some farmers may also vary tillage based on field characteristics or weather. Tillage practices are often part of conservation plans that must be in use on highly erodible land to meet eligibility requirements (conservation compliance) for most Federal agricultural programs, including commodity programs and (after 2014) crop-insurance premium subsidies. This chart is from the ERS report, Conservation-Practice Adoption Rates Vary Widely by Crop and Region, December 2015.