
Labor and land inputs have fallen in U.S. agricultural production, use of intermediate goods has risen
- by Sun Ling Wang
- 7/27/2015
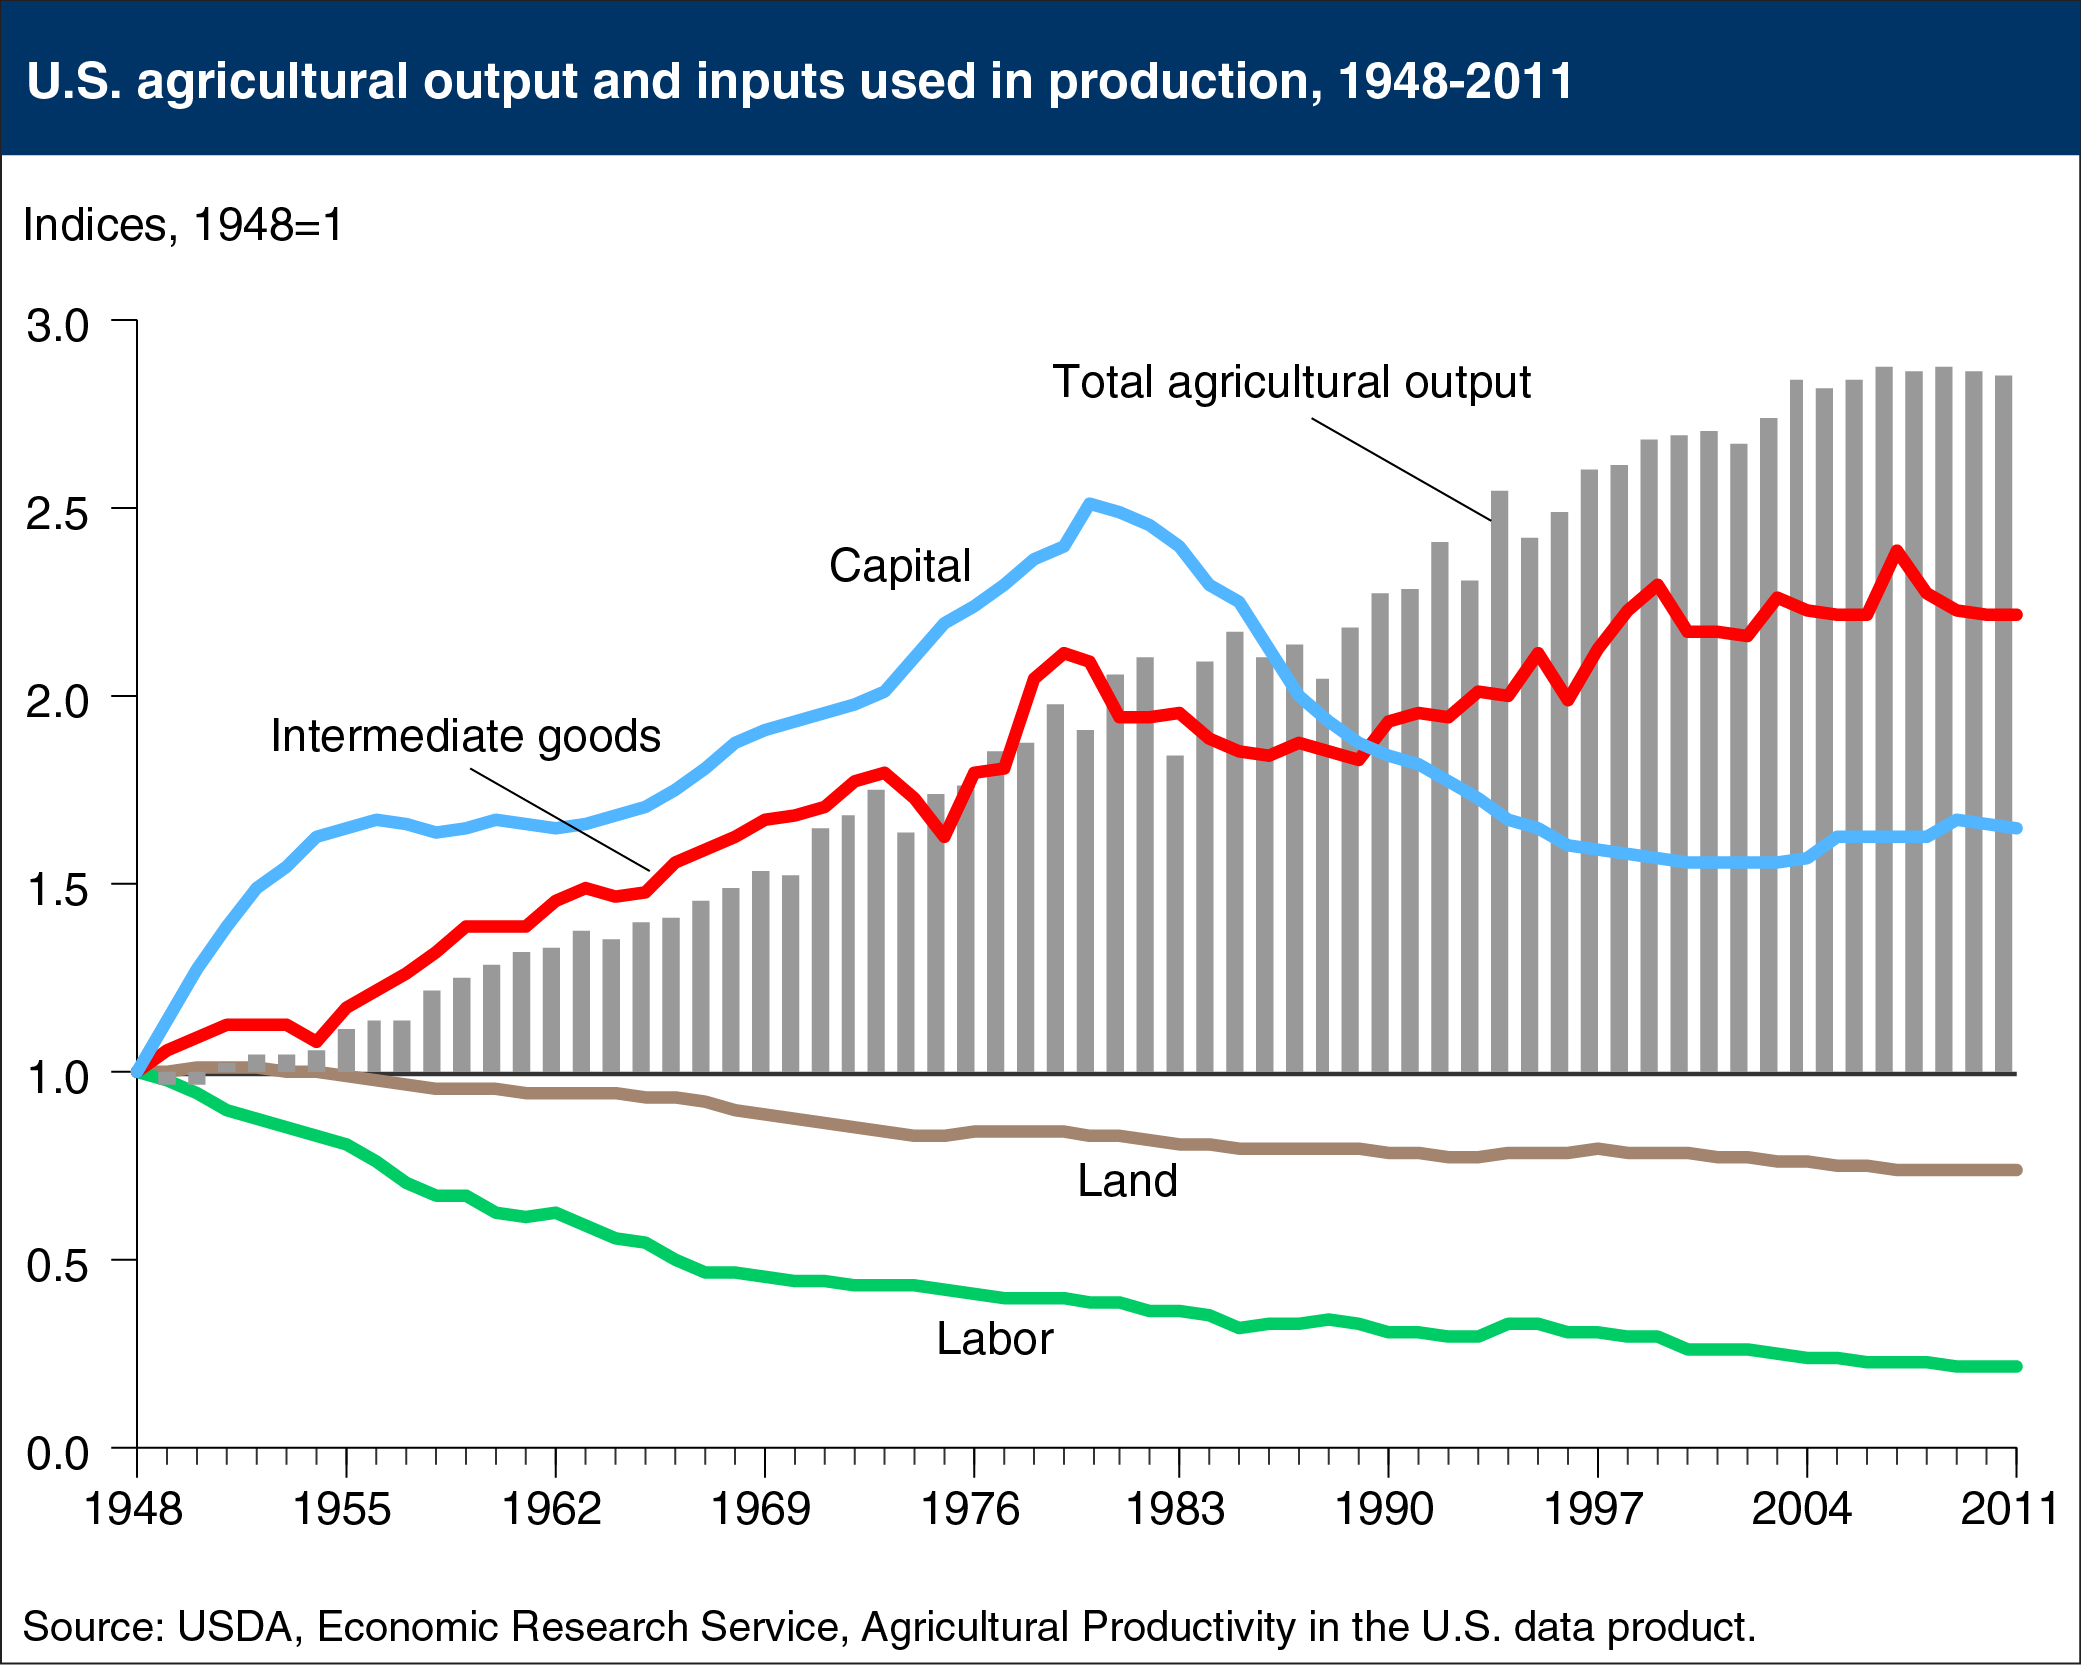
U.S. farm output more than doubled between 1948 and 2011, while aggregate agricultural inputs increased by just 4 percent. However, the composition of agricultural inputs shifted. Between 1948 and 2011, labor use declined by 78 percent, while total land input dropped by 26 percent. The agricultural sector’s consumption of intermediate goods (such as energy, agricultural chemicals, purchased services, and seed/feed) grew by 140 percent, while capital inputs (equipment, buildings, and inventories) increased by 65 percent. The shift in the input mix away from labor and toward machinery and intermediate inputs reflects trends in relative prices, which dropped significantly relative to labor between 1948 and 2011. After 1980, the use of capital inputs fell, while the growth in intermediate inputs slowed considerably. Total agricultural input use fell by 15 percent in 1980-2011, even as output continued to grow. This chart is found in the ERS report, Agricultural Productivity Growth in the United States: Measurement, Trends, and Drivers, July 2015.