
The spread between U.S. and world sugar prices is widening
- by Michael J. McConnell
- 6/26/2015
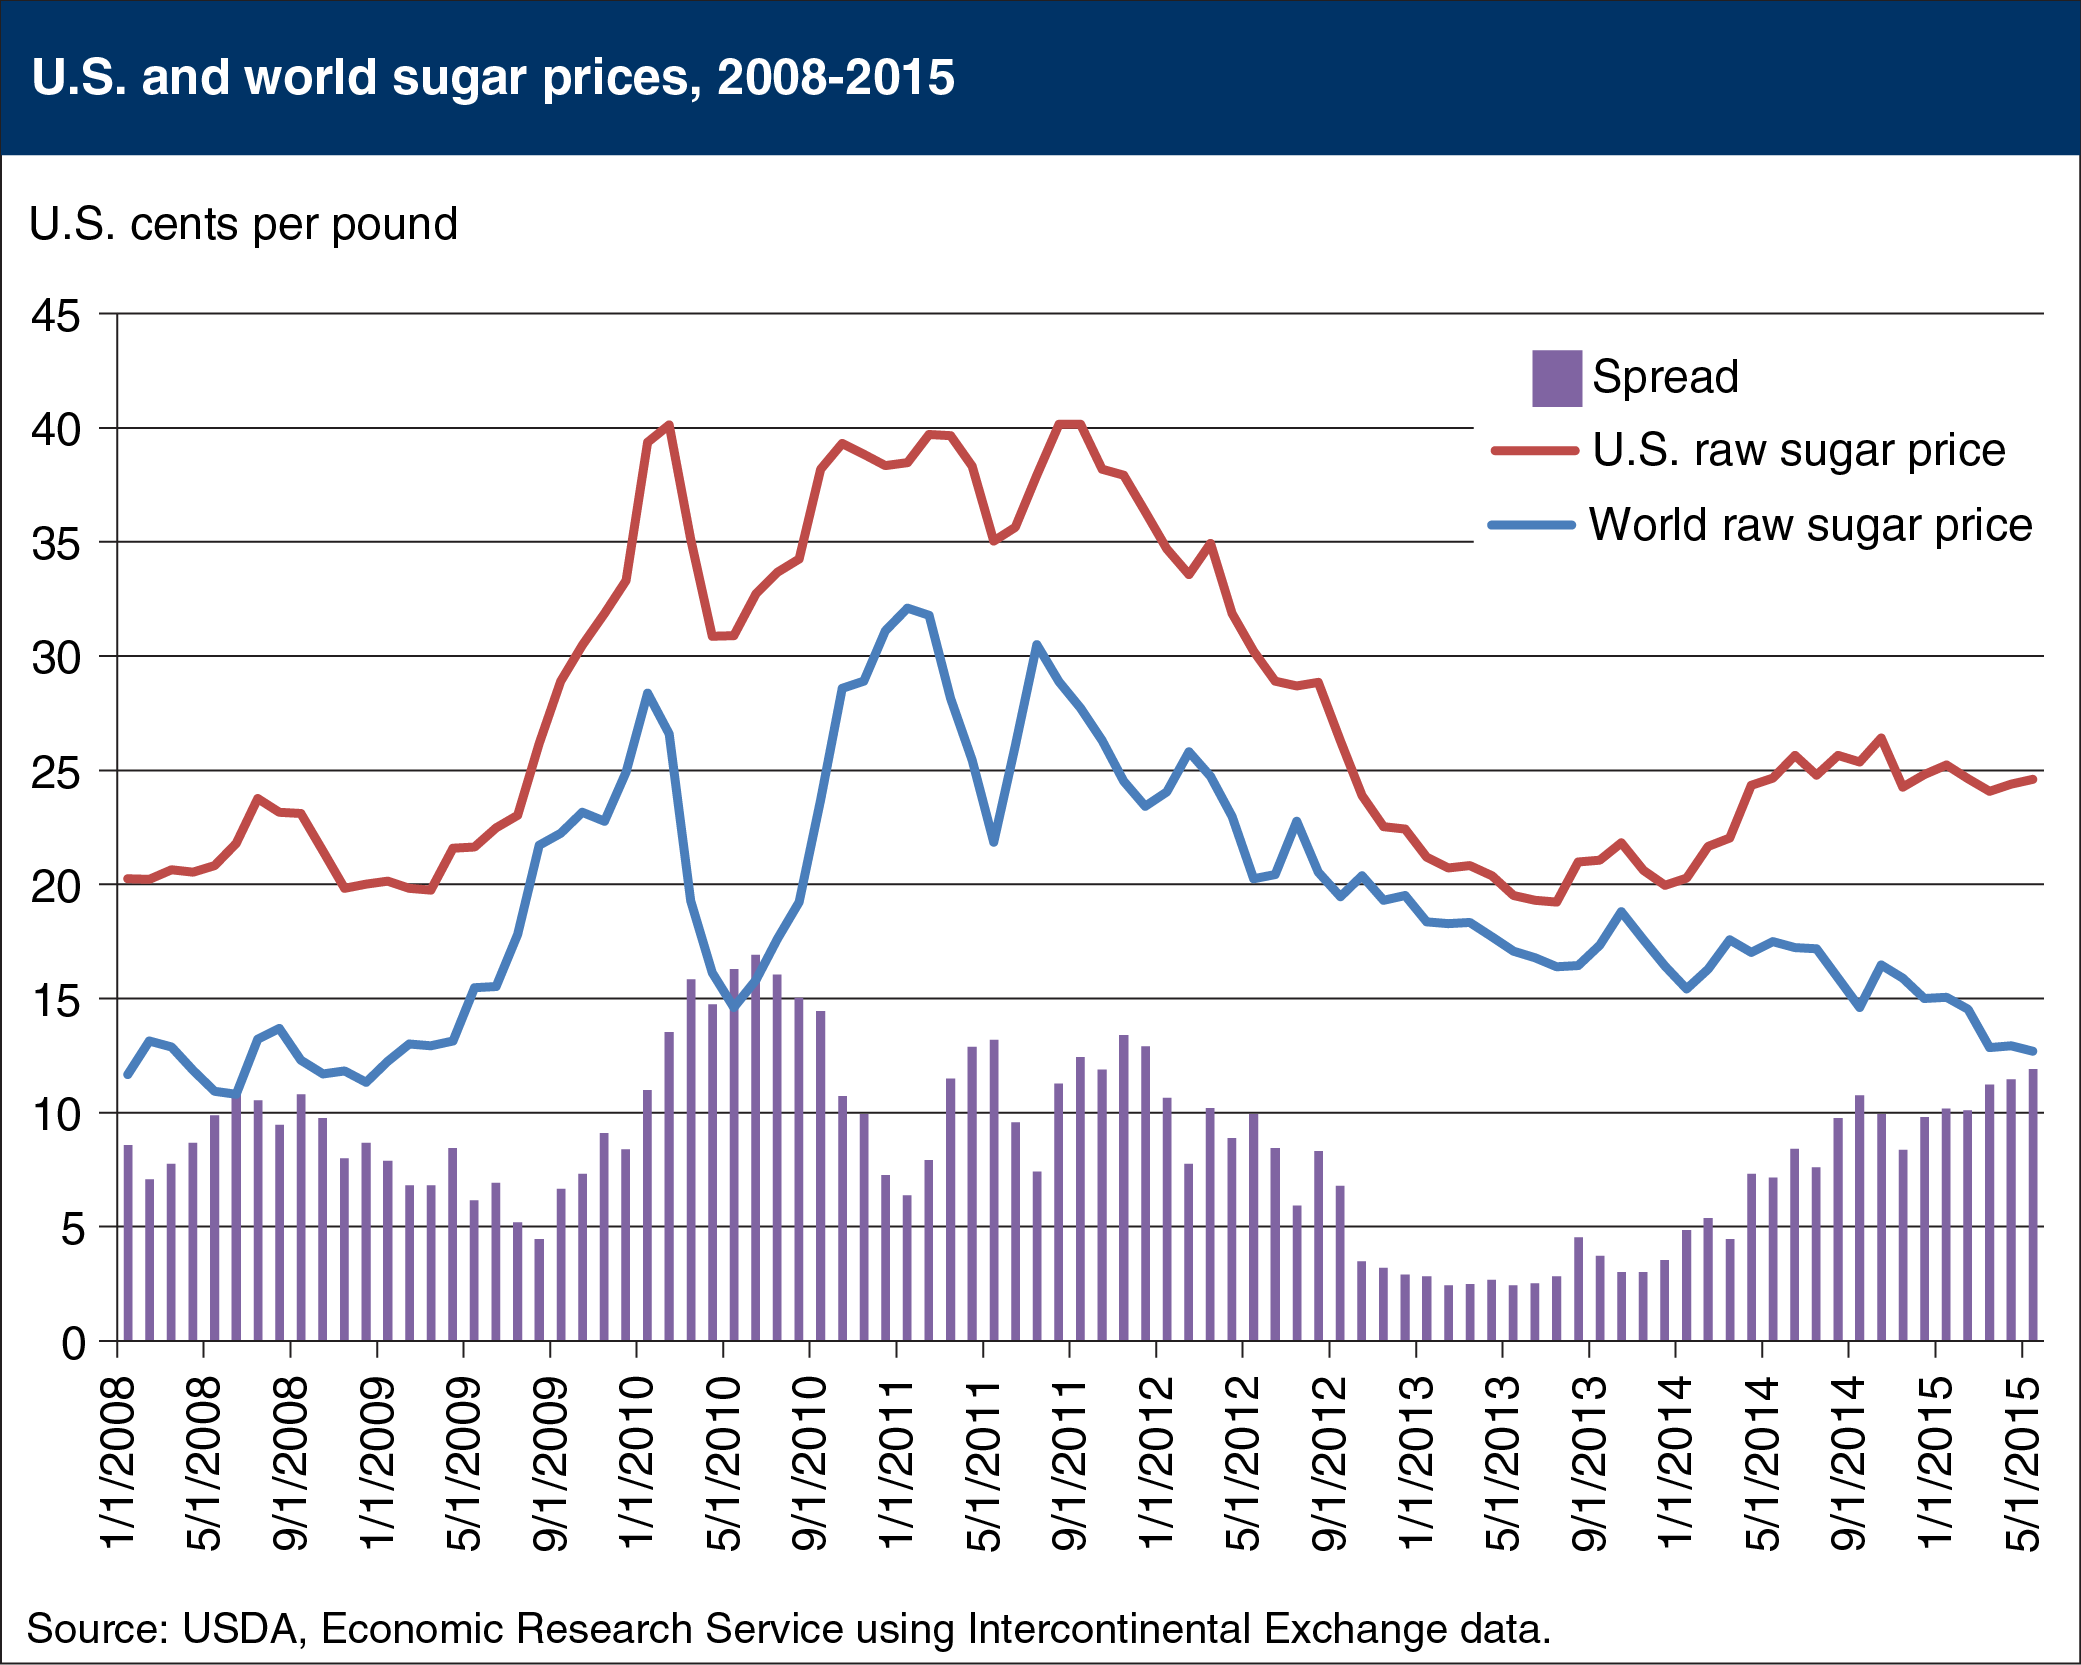
World raw sugar prices have fallen steadily since January 2011, and in May 2015 reached their lowest point since January 2009 due to growing production surpluses and the weakening Brazilian currency. U.S. raw sugar prices have also fallen relative to the record-high levels seen between 2010 and 2012, but have trended higher over the past year. Since the integration of U.S. and Mexican sweetener markets under NAFTA in 2008, U.S. and world prices had tracked more closely. However, those prices began diverging in March 2014 when the U.S. domestic sugar industry filed an anti-dumping and countervailing duty investigation against Mexican sugar imports, resulting in a December 2014 agreement that limits the volume of Mexican sugar entering the United States. With these new limitations on Mexican imports, the spread between U.S. and world prices has increased in recent months, though remains within ranges seen in recent years. This chart is based on the June 2015 Sugar and Sweeteners Outlook.