
Composition of production expenses varies by farm commodity specialization
- by Chris McGath
- 6/19/2015
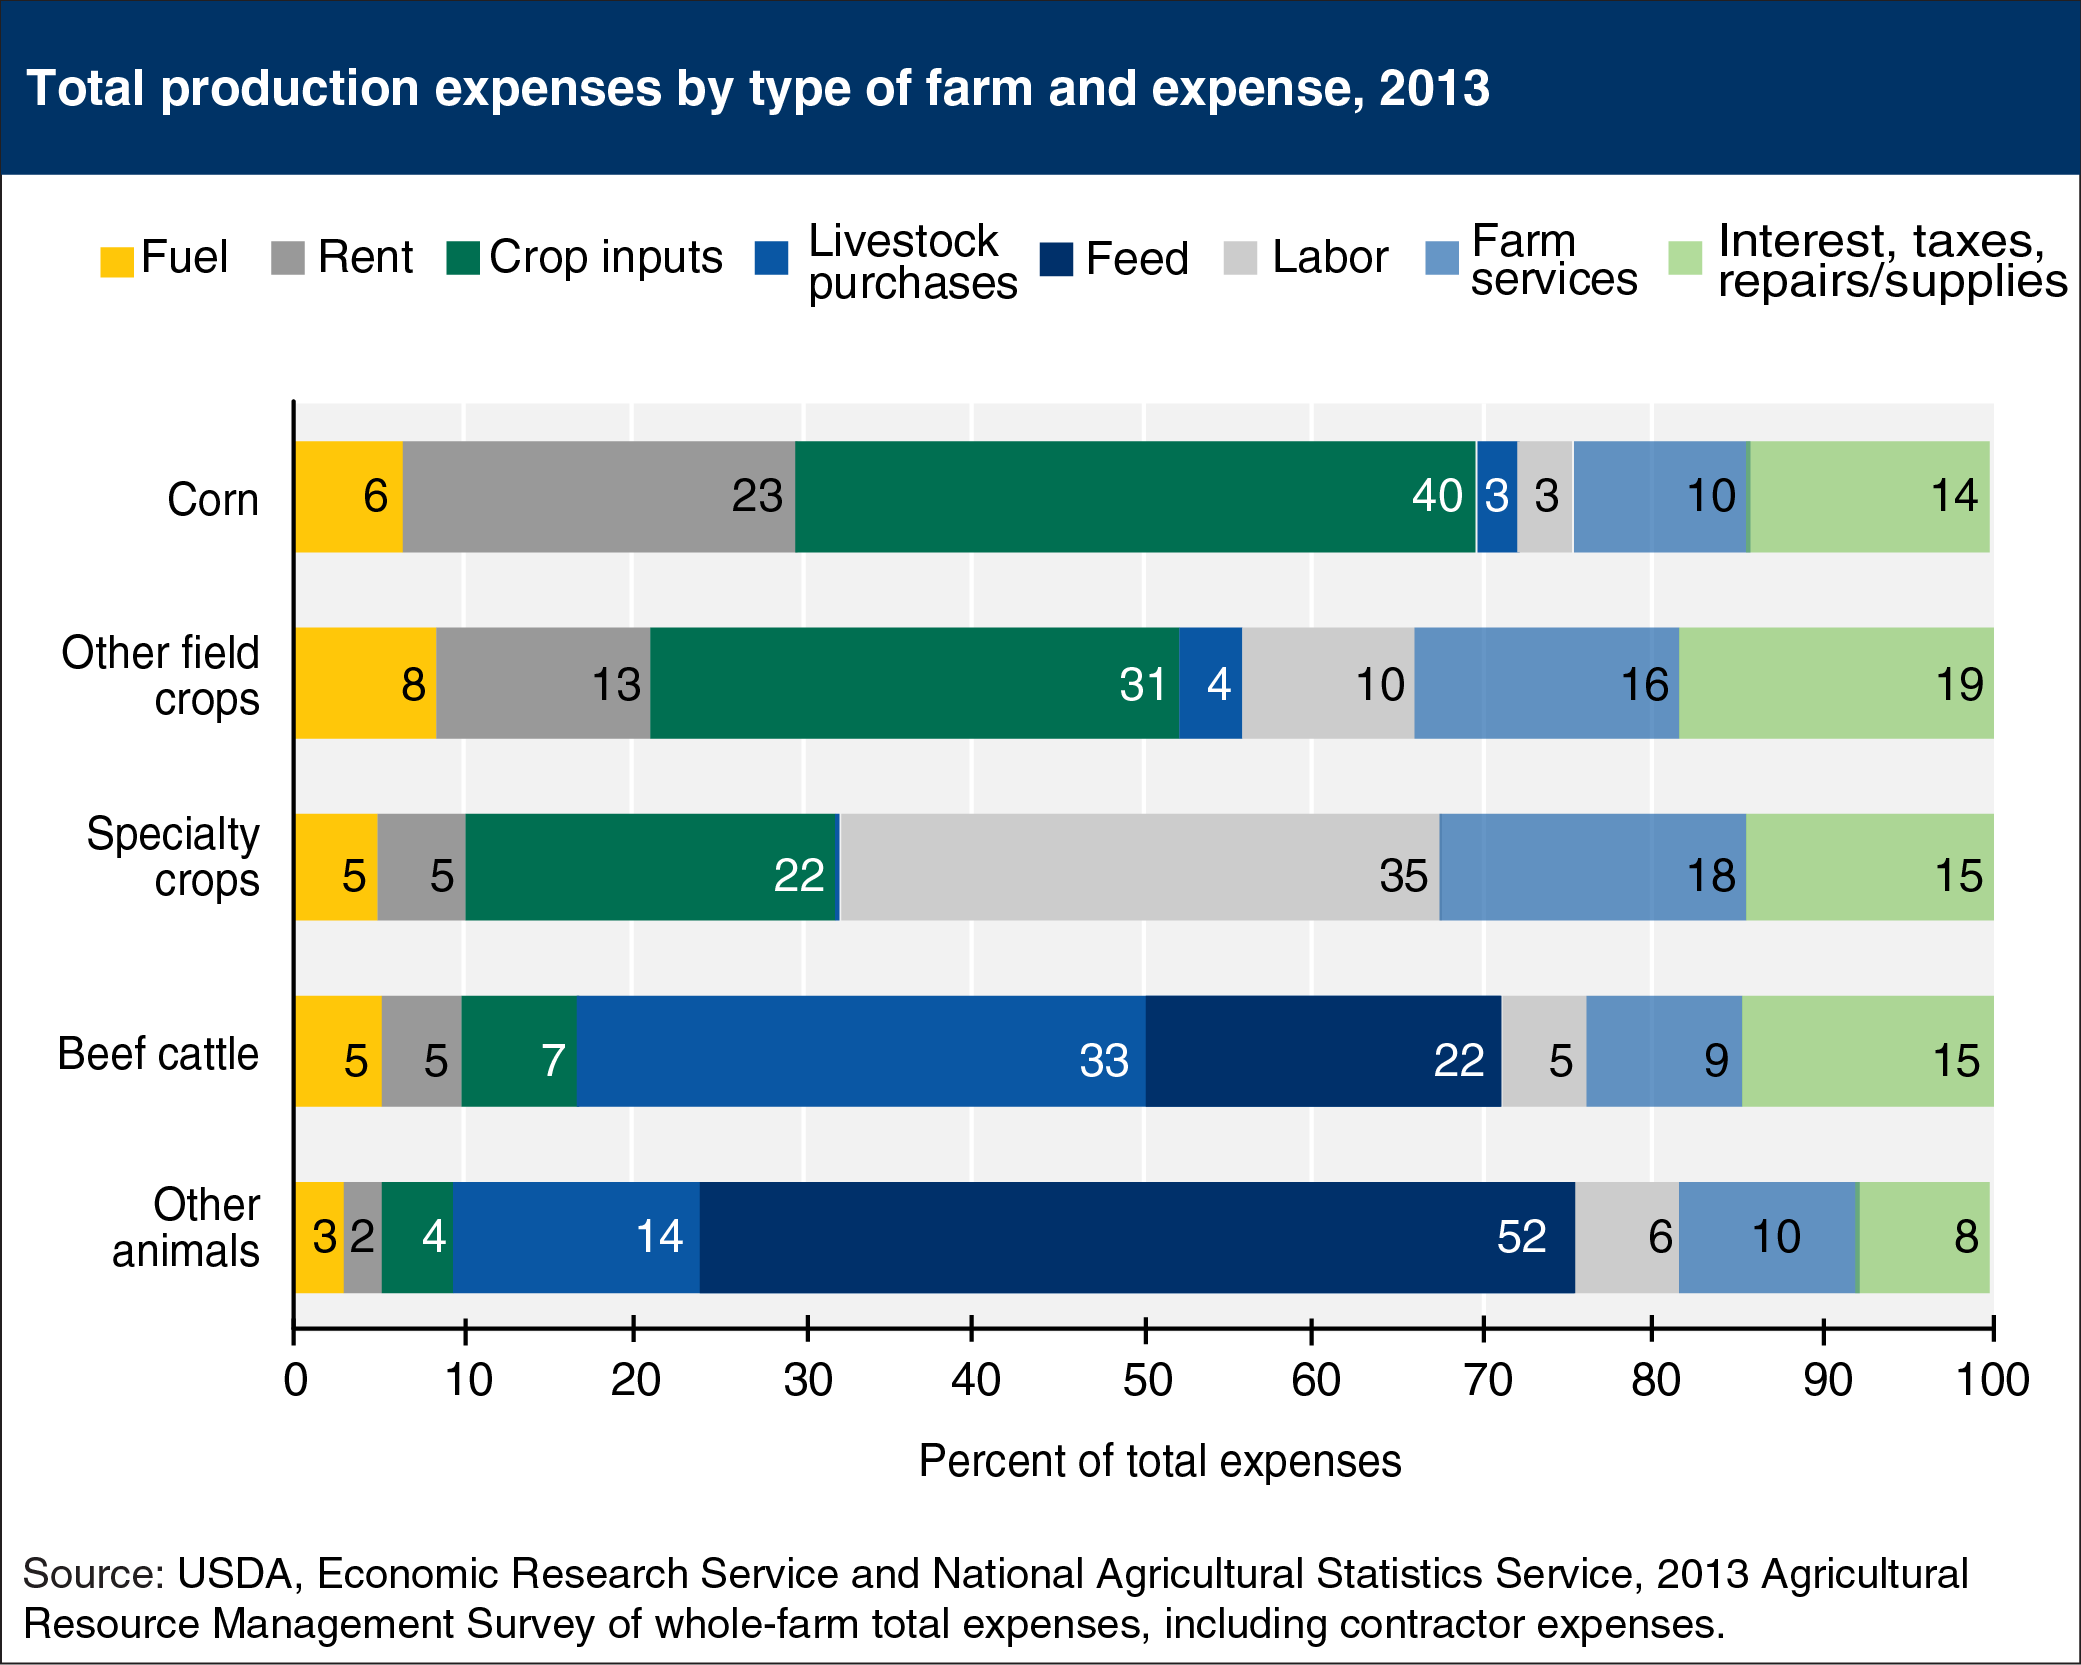
The variation in the percent of total expenses represented by individual expenses across different types of farms reflects how specialized U.S. agriculture has become. While wide differences generally exist between crop and livestock farms, USDA’s Agricultural Resource Management Survey (ARMS) allows a breakdown of expense shares within the major farm types. Livestock purchases are the largest component of total expenses for beef cattle farms, primarily because of the relatively high cost of feeder steers. Because of the lower cost of their animal purchases, feed expenses are the largest component of total expenses for other animal farms (primarily hog, poultry, and dairy). Specialty crop farms (fruit/nuts, vegetables, and nursery/greenhouse) have a higher share of labor expenses than field crop farms, because they occupy fewer acres and are less mechanized. In contrast, field crop farms, especially corn farms, have higher shares of expenses going to principal crop-related expenses (fertilizer, seeds, and chemicals), and rent. Fuel expenses are relatively consistent, varying between 3 percent of total expenses for other animal farms to 8 percent for other field crop farms. This chart is based on results from USDA’s ARMS Farm Financial and Crop Production Practices data.