
Food accounts for 13 percent of American households' budgets
- by Annemarie Kuhns
- 12/16/2014
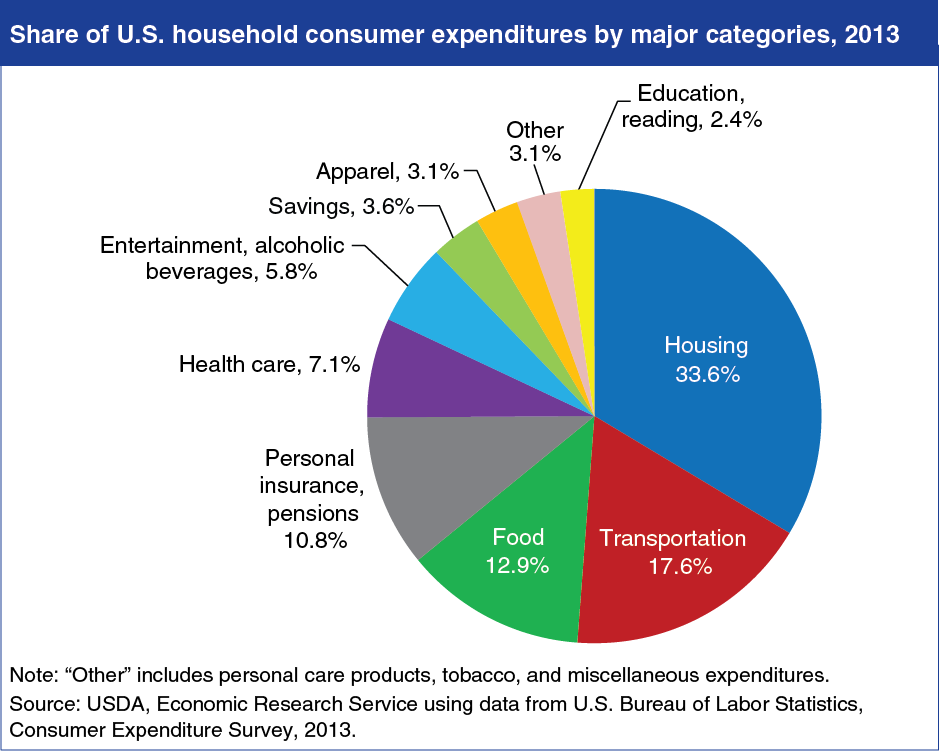
With a 12.9-percent share, food ranked third behind housing (33.6 percent) and transportation (17.6 percent) in a typical American household’s 2013 expenditures. Breaking down food spending further, 7.8 percent of expenditures were spent at the grocery store and 5.1 percent at restaurants. Price changes for the items in the different budget categories relative to each other play a role in the categories’ shares of annual household consumer expenditures. Over the last 10 years, retail food price inflation has often outpaced economy-wide inflation. Between 2004 and 2013, prices for all U.S. goods and services rose an average of 2.4 percent per year, while food prices increased an average of 2.8 percent. Despite higher food price inflation, food’s share of consumer expenditures fell slightly (0.4 percentage points) over the decade, as the budget shares for health care and housing rose. This chart appears in the ERS data product, Ag and Food Statistics: Charting the Essentials. More information on ERS’s food price forecasts can be found in ERS’s Food Price Outlook data product.