
U.S. broiler production has leveled off after decades of rapid growth
- by James M. MacDonald
- 7/1/2014
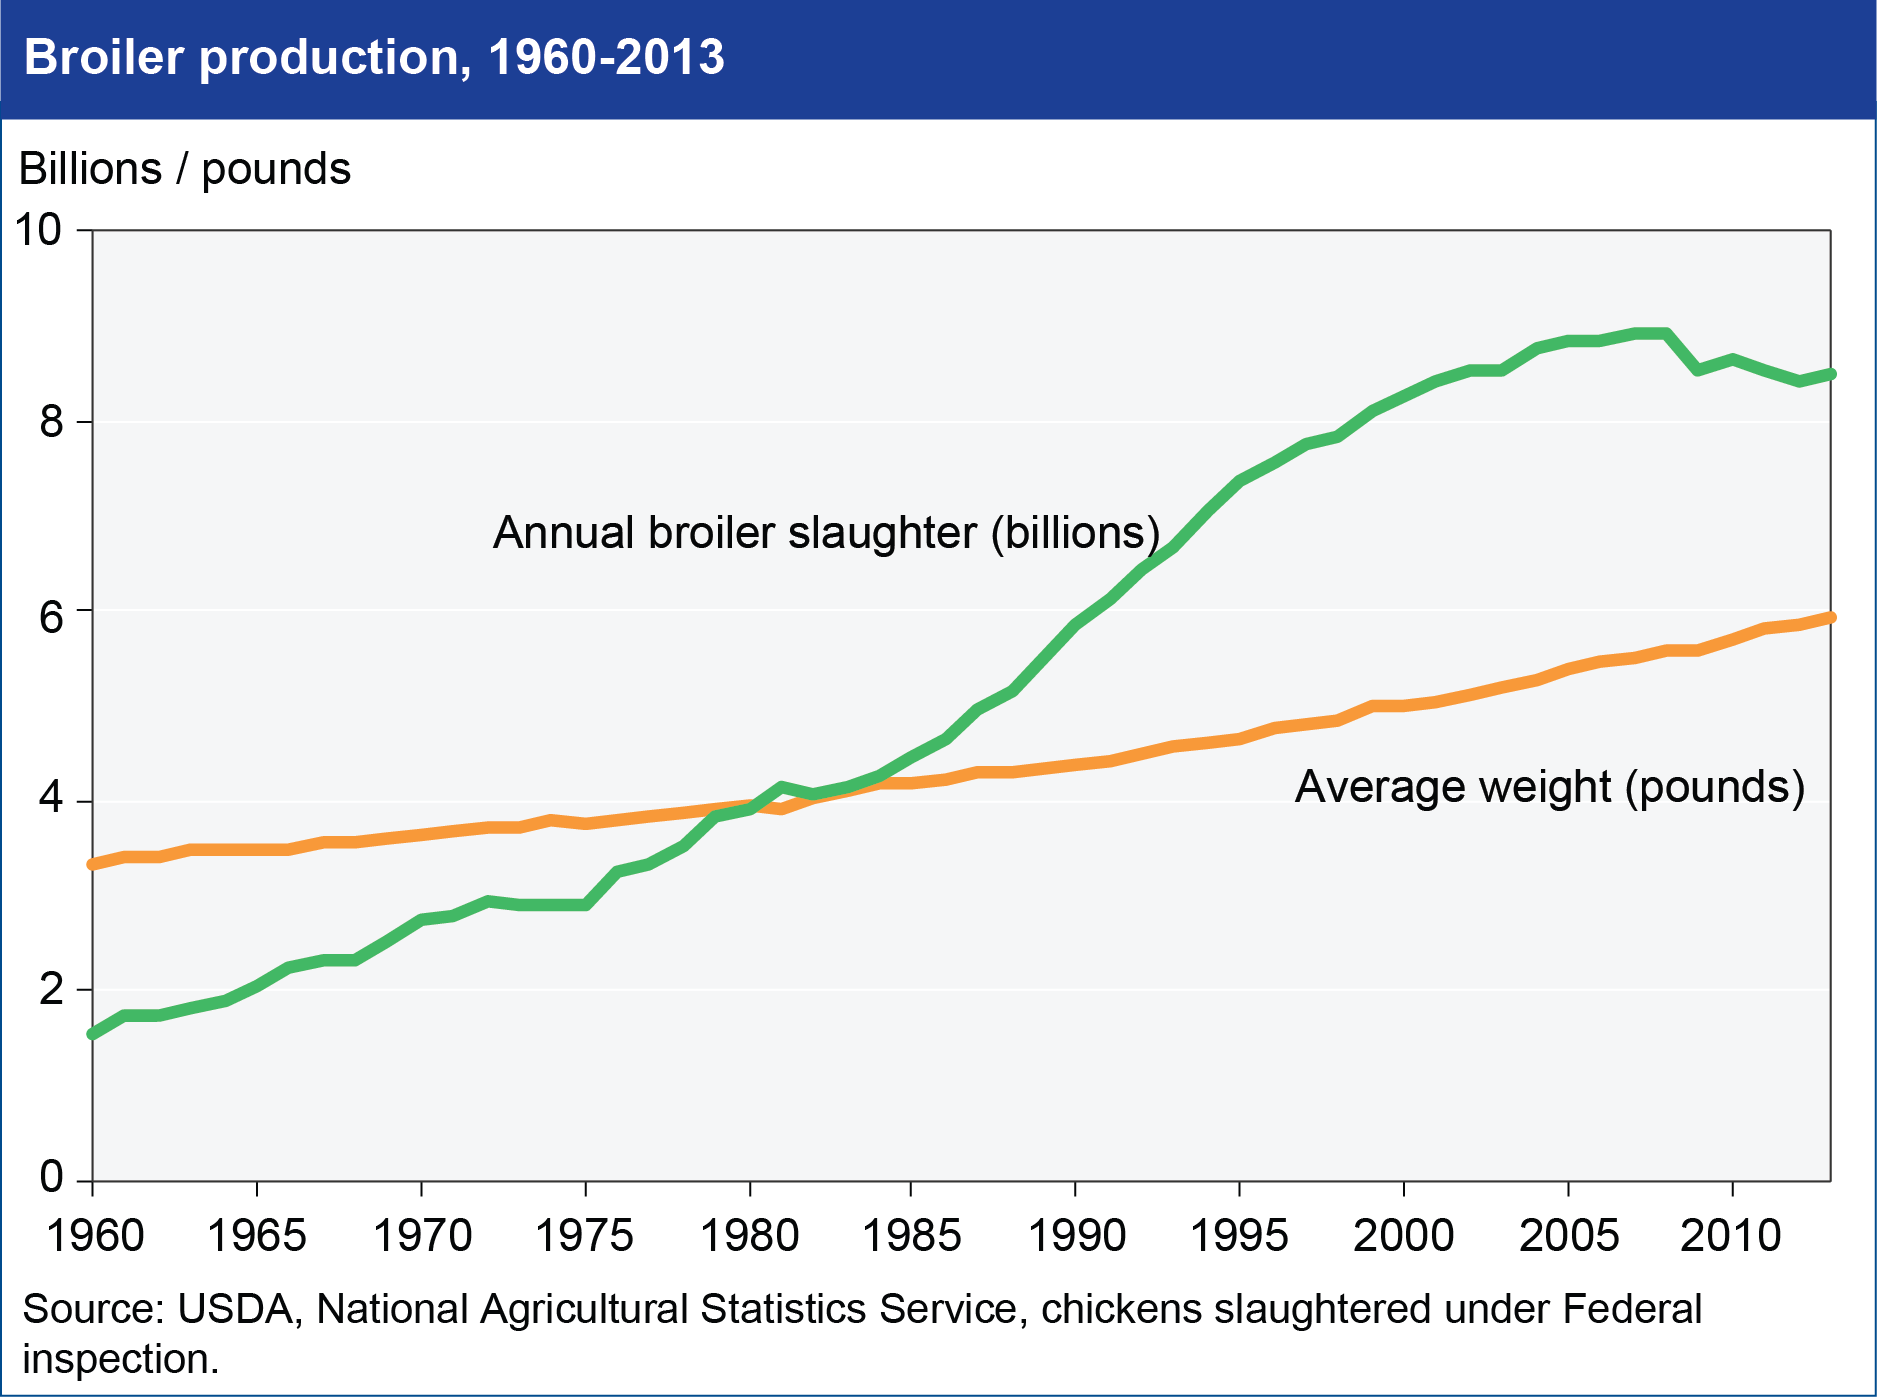
Between 1960 and 1995, annual broiler slaughter in the United States grew from 1.5 to 7.4 billion birds—4.6 percent per year, on average. With birds also getting larger—from an average of 3.35 pounds to 4.66—total live-weight production grew at an average rate of 5.6 percent per year. While average weights continued to grow steadily after 1995, growth in annual slaughter slowed sharply and then fell in 2009 and again in 2012. Total live-weight production reached 49.8 billion pounds in 2008, but did not exceed that figure until 2013. In all, live-weight production grew by just 1.3 percent per year between 2003 and 2013, one-fourth of the 1960-1995 growth rate. High production growth in earlier decades—and slowing growth later—reflected movements in demand for chicken meat. The cessation of broiler industry growth, due to slowing growth in population, per capita consumption of chicken, and exports, places new financial pressures on broiler producers and new stresses on industry organization. This chart is found in Technology, Organization, and Financial Performance in U.S. Broiler Production, EIB-126, June 2014.