
Nearly two-thirds of rural U.S. counties have lost population since 2010
- by John Cromartie
- 5/14/2014
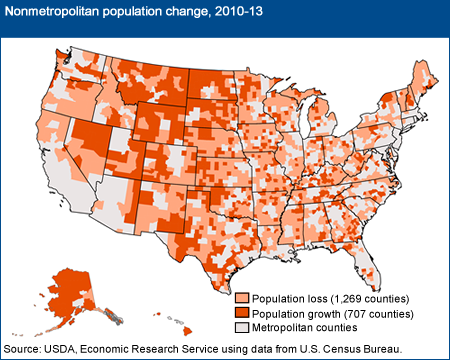
Population change is varied across rural and small-town America. Since 2010, over 1,200 rural (nonmetropolitan) counties have lost population, with declines totaling nearly 400,000 people. At the same time, the population of just over 700 rural counties grew, together adding just over 300,000 residents. New regional patterns of growth and decline emerged in recent years. Areas of population decline appeared for the first time in the eastern United States, including New England, the North Carolina-Virginia border, and southern Ohio. Falling birth rates, an aging rural population, and a declining manufacturing base contributed to population downturns in these regions. In the Mountain West, population growth also slowed considerably, and in some cases turned negative, for the first time in decades, affecting numerous counties in western Colorado and Wyoming, central Oregon, and northern Idaho. In contrast, an energy boom has spurred population growth in sections of the northern Great Plains that had previously experienced long-term population declines. This map is found in the ERS topic page on Rural Population and Migration, updated April 2014.