
Rural population decline continues in 2013
- by John Cromartie
- 4/7/2014
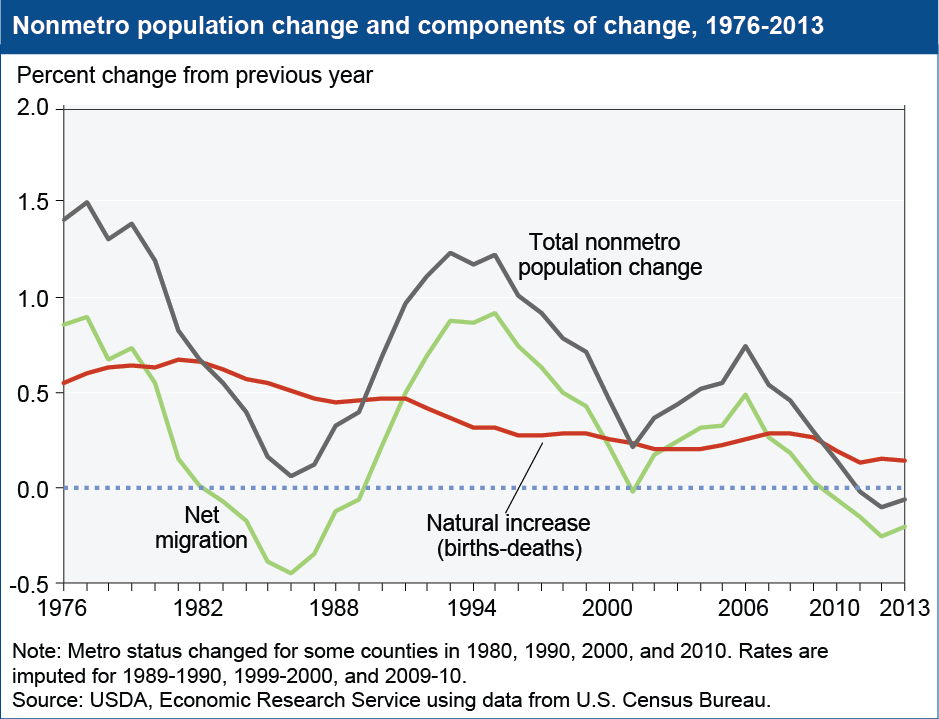
Rural population (determined by nonmetropolitan status) declined for the third year in a row according to population estimates released last week by the U.S. Census Bureau. While hundreds of individual counties have lost population over the years, especially in remote or sparsely-settled regions, this marks the first period of population decline for rural (nonmetro) areas as a whole. Population declines stem from a combination of fewer births, more deaths, and changing migration patterns. Since 2010, the increase in rural population that came from natural change (193,000 more births than deaths) has not matched the decrease in population from net migration (276,000 more people moved out than moved in). While natural change has gradually trended downward over time, net migration rates tend to fluctuate in response to economic conditions. Thus, this period of rural population loss may be short-lived depending on the course of the economic recovery. This chart is found in the ERS topic page on Population and Migration, updated April 2014.