
Food price inflation was greater than overall inflation over last half decade
- Contact: Website Administrator
- 2/20/2014
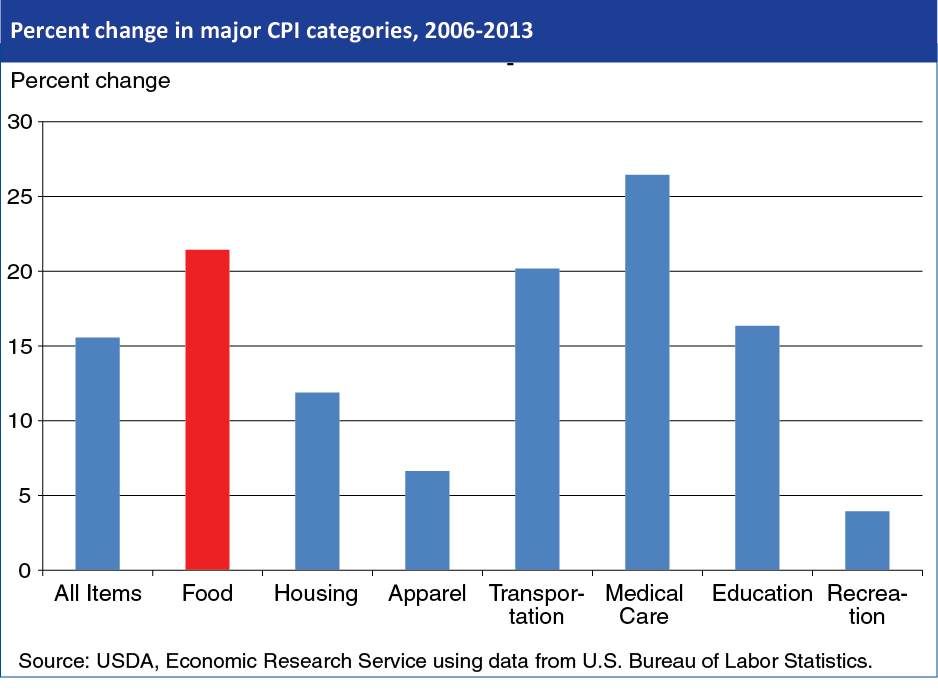
Since 2006, a series of factors—including spikes in energy prices, inflation-adjusted price increases for agricultural commodities, major weather events, expanding global food demand, and the U.S. economic recession and subsequent recovery—have caused price inflation for food to outpace many other consumer spending categories. The all-items CPI is a measure of economy-wide inflation covering all consumer purchases of goods and services. Between 2006 and 2013, the all-items CPI increased by slightly more than 15 percent. During the same time, the all-food CPI was up more than 21 percent, indicating that food has become relatively more expensive for U.S. households over this time period. Among the major expenditure categories tracked by the U.S. Bureau of Labor Statistics, only prices for medical care have risen faster than food prices. The all-food CPI increased 1.4 percent in 2013, below the average of 2.8 percent for the last 20 years. Food price inflation is expected to be between 2.5 and 3.5 percent in 2014. This chart appears in ERS’s data product, Ag and Food Statistics: Charting the Essentials, updated February 11, 2014.