
Internationally, at-home food spending varies more than calorie availability
- by Birgit Meade
- 1/17/2014
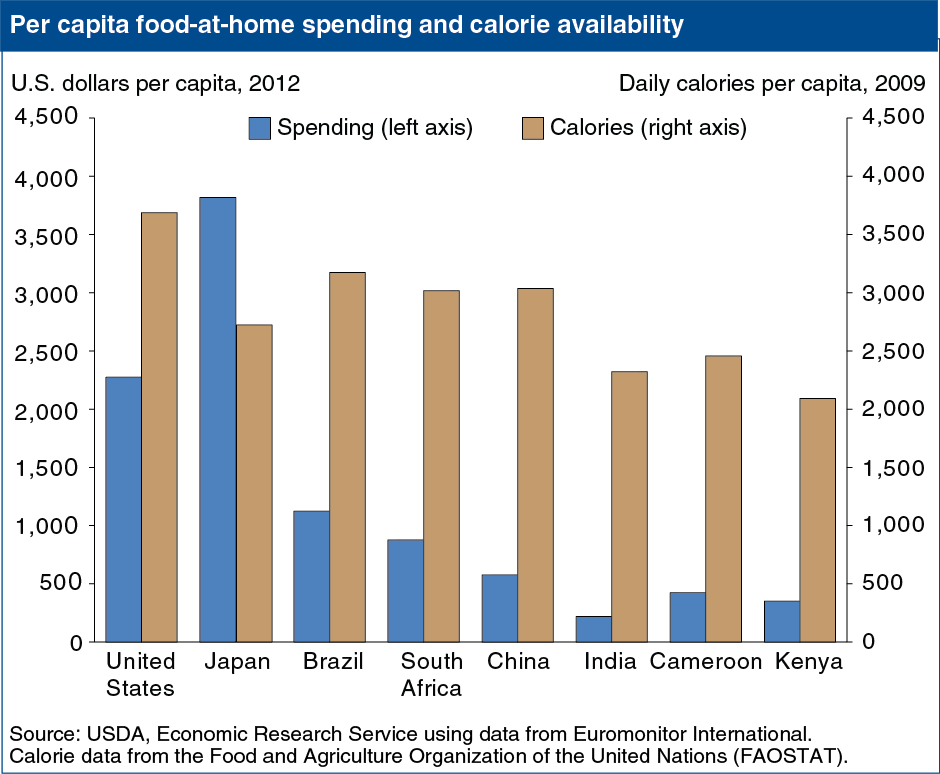
Per capita food-at-home spending varies widely across countries, reflecting general food price levels, prices for particular foods (grains versus meats), and for higher income countries, the mix of at-home and away-from-home spending. In poorer countries, diets consist mostly of lower cost grains, such as corn and sorghum, and roots such as cassava. In Kenya, corn makes up about one-third of total calories consumed. In 2012, food-at-home spending was $2,273 per person in the United States and $350 in Kenya. Calorie availability in 2009 displayed a narrower range from 3,688 calories per person per day in the United States to 2,092 calories in Kenya. Japanese consumers outspent U.S. consumers on at-home foods by $1,545 per person, but per-person calorie availability in Japan (2,723 calories per day) was lower. This chart appears in ERS’s data product, Ag and Food Statistics: Charting the Essentials, updated December 9, 2013.