
Farmers adjust to rising fertilizer prices in a variety of ways
- by Economic Research Service
- 8/12/2013
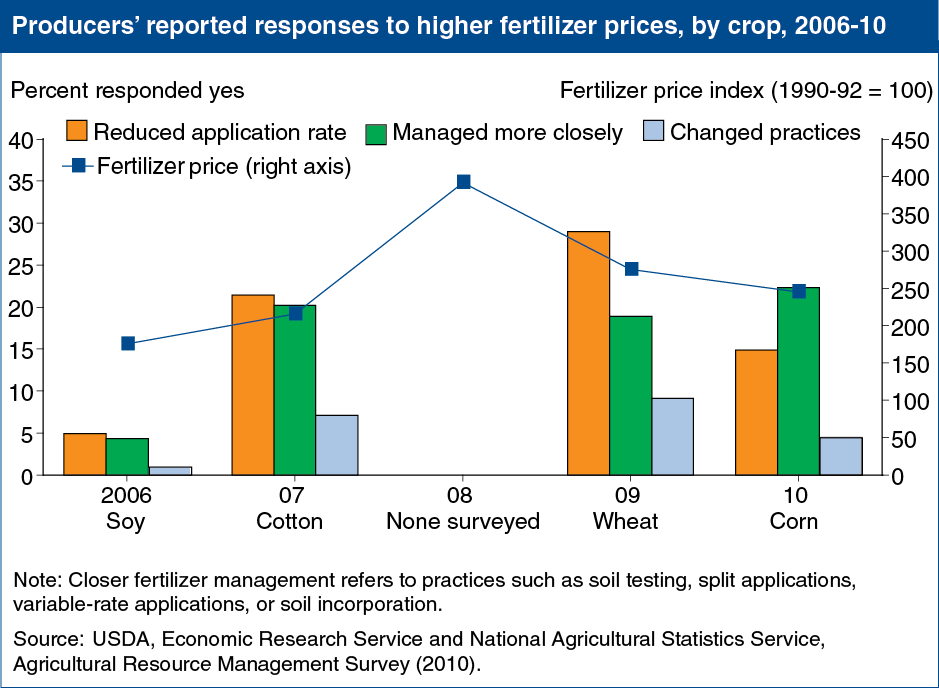
Fertilizer prices have increased overall since 2006, reaching historical highs in 2008. Fertilizers are an important input into farming and higher prices have forced farmers to alter their use. Beginning in 2006, USDA’s Agricultural Resource Management Survey (ARMS) asked farm operators how they adjusted their operations in response to higher fertilizer and fuel prices. For most crops (soy, cotton, and wheat) farmers responded to higher prices by reducing their application rate. However, the largest users of fertilizer—corn farmers—responded most often that they managed fertilizer use more closely, for example by using practices such as soil testing, split applications, variable-rate applications, or soil incorporation. This chart is found in the ERS report, Agriculture's Supply and Demand for Energy and Energy Products, EIB-112, May 2012.