
SNAP participation response to 2008-10 economic decline was similar to previous downturns
- by Economic Research Service
- 7/16/2013
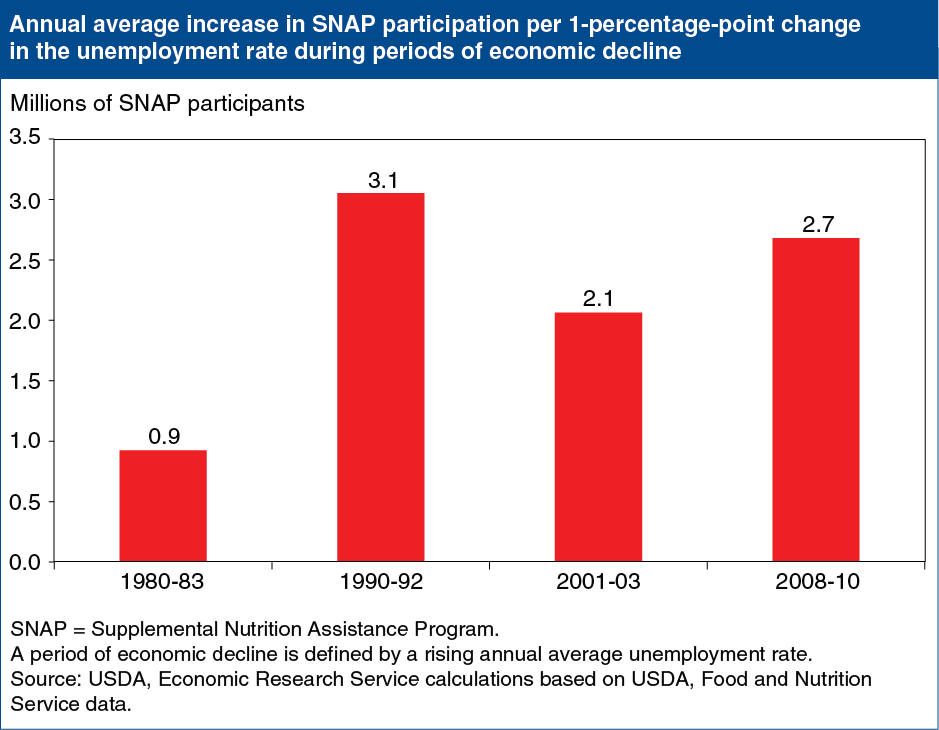
As USDA’s largest food and nutrition assistance program, the Supplemental Nutrition Assistance Program (SNAP) provides a nutritional safety net for millions of low-income children and adults, a role that is especially important when the economy falters and many Americans lose jobs and income. The increase in SNAP participation during 2008-10—a period of rising unemployment—was the largest participation increase since the current program began in the early 1960s, but the unemployment rate hike was the largest since that time as well. At a time when the unemployment rate increased from 4.5 percent in 2007 to 9.8 percent in 2010, the number of Americans receiving SNAP benefits grew from an average of 26.3 million in 2007 to 40.3 million in 2010. However, when the increase in SNAP participants is adjusted for the increase in the unemployment rate, the caseload increased by 2.7 million participants per 1-percentage-point increase in the unemployment rate, which is similar to the previous two economic declines. The statistics for this chart are from the ERS publication, How Economic Conditions Affect Participation in USDA Nutrition Assistance Programs.