
Farm share of U.S. food dollar up in 2011
- by Economic Research Service
- 3/27/2013
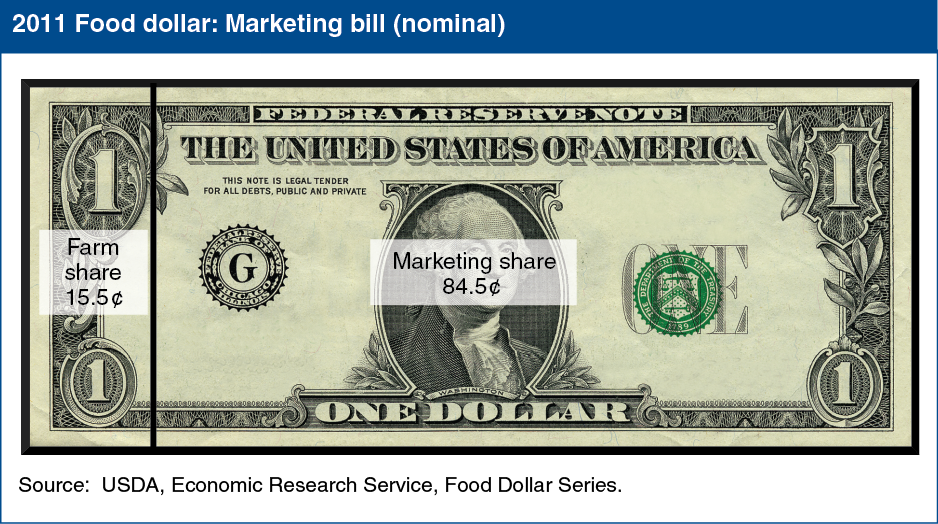
For each dollar spent in 2011 by U.S. consumers on domestically produced food, U.S. farmers sold 15.5 cents (farm share) of farm products, on average. The remaining 84.5 cents (marketing share) come from costs for transporting, packaging, processing, retailing, and other costs to market these farm commodities to domestic food consumers. ERS uses input-output analysis to calculate the average farm share and marketing share for the total food dollar, which includes both grocery store and eating out purchases. After falling to 14.1 cents in 2010, the farm share in 2011 rose to a level comparable with 2007-08 levels. This chart is from the Food Dollar Series data product on the ERS website, updated March 5, 2013.