
Population trends in U.S. nonmetro counties vary by age group and natural amenity/accessibility levels
- by John Cromartie and David McGranahan
- 12/17/2012
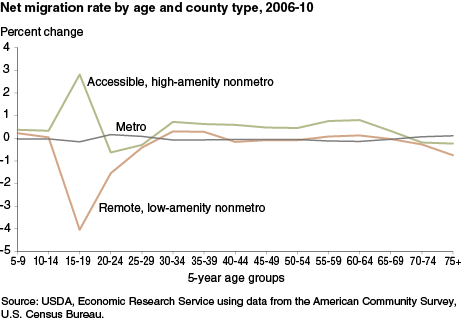
For many decades, most U.S. nonmetro counties experienced significant population loss among young adults, especially in the years immediately following high school graduation. Some of that population loss was offset by net gains among individuals in their late 20s and 30s. While this population pattern does not hold in amenity-rich areas with easy access to urban areas, it continues in remote, low-amenity nonmetro counties (identified based on urban accessibility measures and the ERS Natural Amenities Index). A large share of those moving into these remote areas during their late 20s and 30s are childhood residents returning with spouses and children to their home communities. This chart is found in the December 2012 issue of Amber Waves magazine.