
Irrigated acres vary across regions and over time
- by Economic Research Service
- 9/13/2012
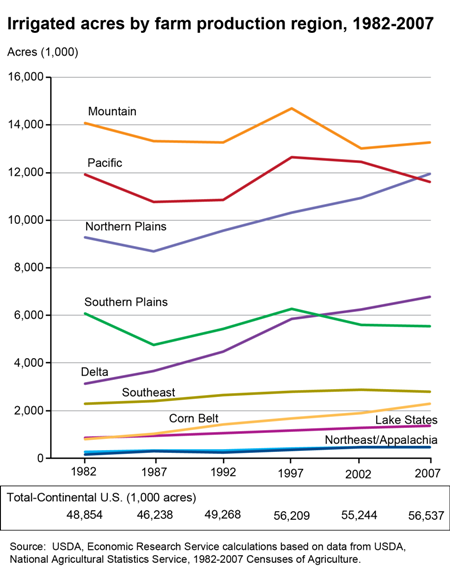
From 1982 to 1997, irrigated acres increased for most farm regions. Since 1997, however, most regions have seen either slow growth or a decline in irrigated acres. The largest growth in irrigated acres since 1997 is concentrated in the Northern Plains, Delta, and Corn Belt regions. Growth rates in the Northern Plains (primarily Nebraska) pushed irrigated acreage (at 11.9 million acres in 2007) above acreage irrigated in the Pacific region (at 11.6 million acres). Similarly, since 1997, irrigated acres in the Delta region surpassed acres irrigated in the Southern Plains. Over the same period, irrigated acres contracted in the relatively arid Mountain, Pacific, and Southern Plains regions. This chart comes from Water Conservation in Irrigated Agriculture: Trends and Challenges in the Face of Emerging Demand, EIB-99, September 2012.