
Gap in population growth rates for rural and urban areas continues to widen
- by Economic Research Service
- 9/11/2012
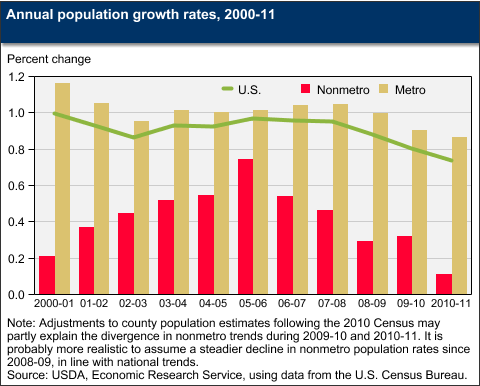
Nonmetro America had just over 51 million residents in July 2011, a 4.5 percent increase in population over the past decade. The rate of population growth in nonmetro America slowed dramatically after the onset of the housing mortgage crisis in 2006 and the recession a year later. Over 250,000 people were added to the nonmetro population between July 2005 and July 2006, compared with an average below 150,000 per year since then. This partially reflects a decline in the rate of growth for the U.S. population as a whole, as a result of lower immigration rates since 2007. However, nonmetro counties have also been affected by lower rates of natural increase and fewer in-migrants from metro areas. This chart is from the Population and Migration topic page on the ERS website.
We’d welcome your feedback!
Would you be willing to answer a few quick questions about your experience?