
Crop research and development spending tracks sales revenue by major seed companies
- by Keith Fuglie
- 9/18/2023
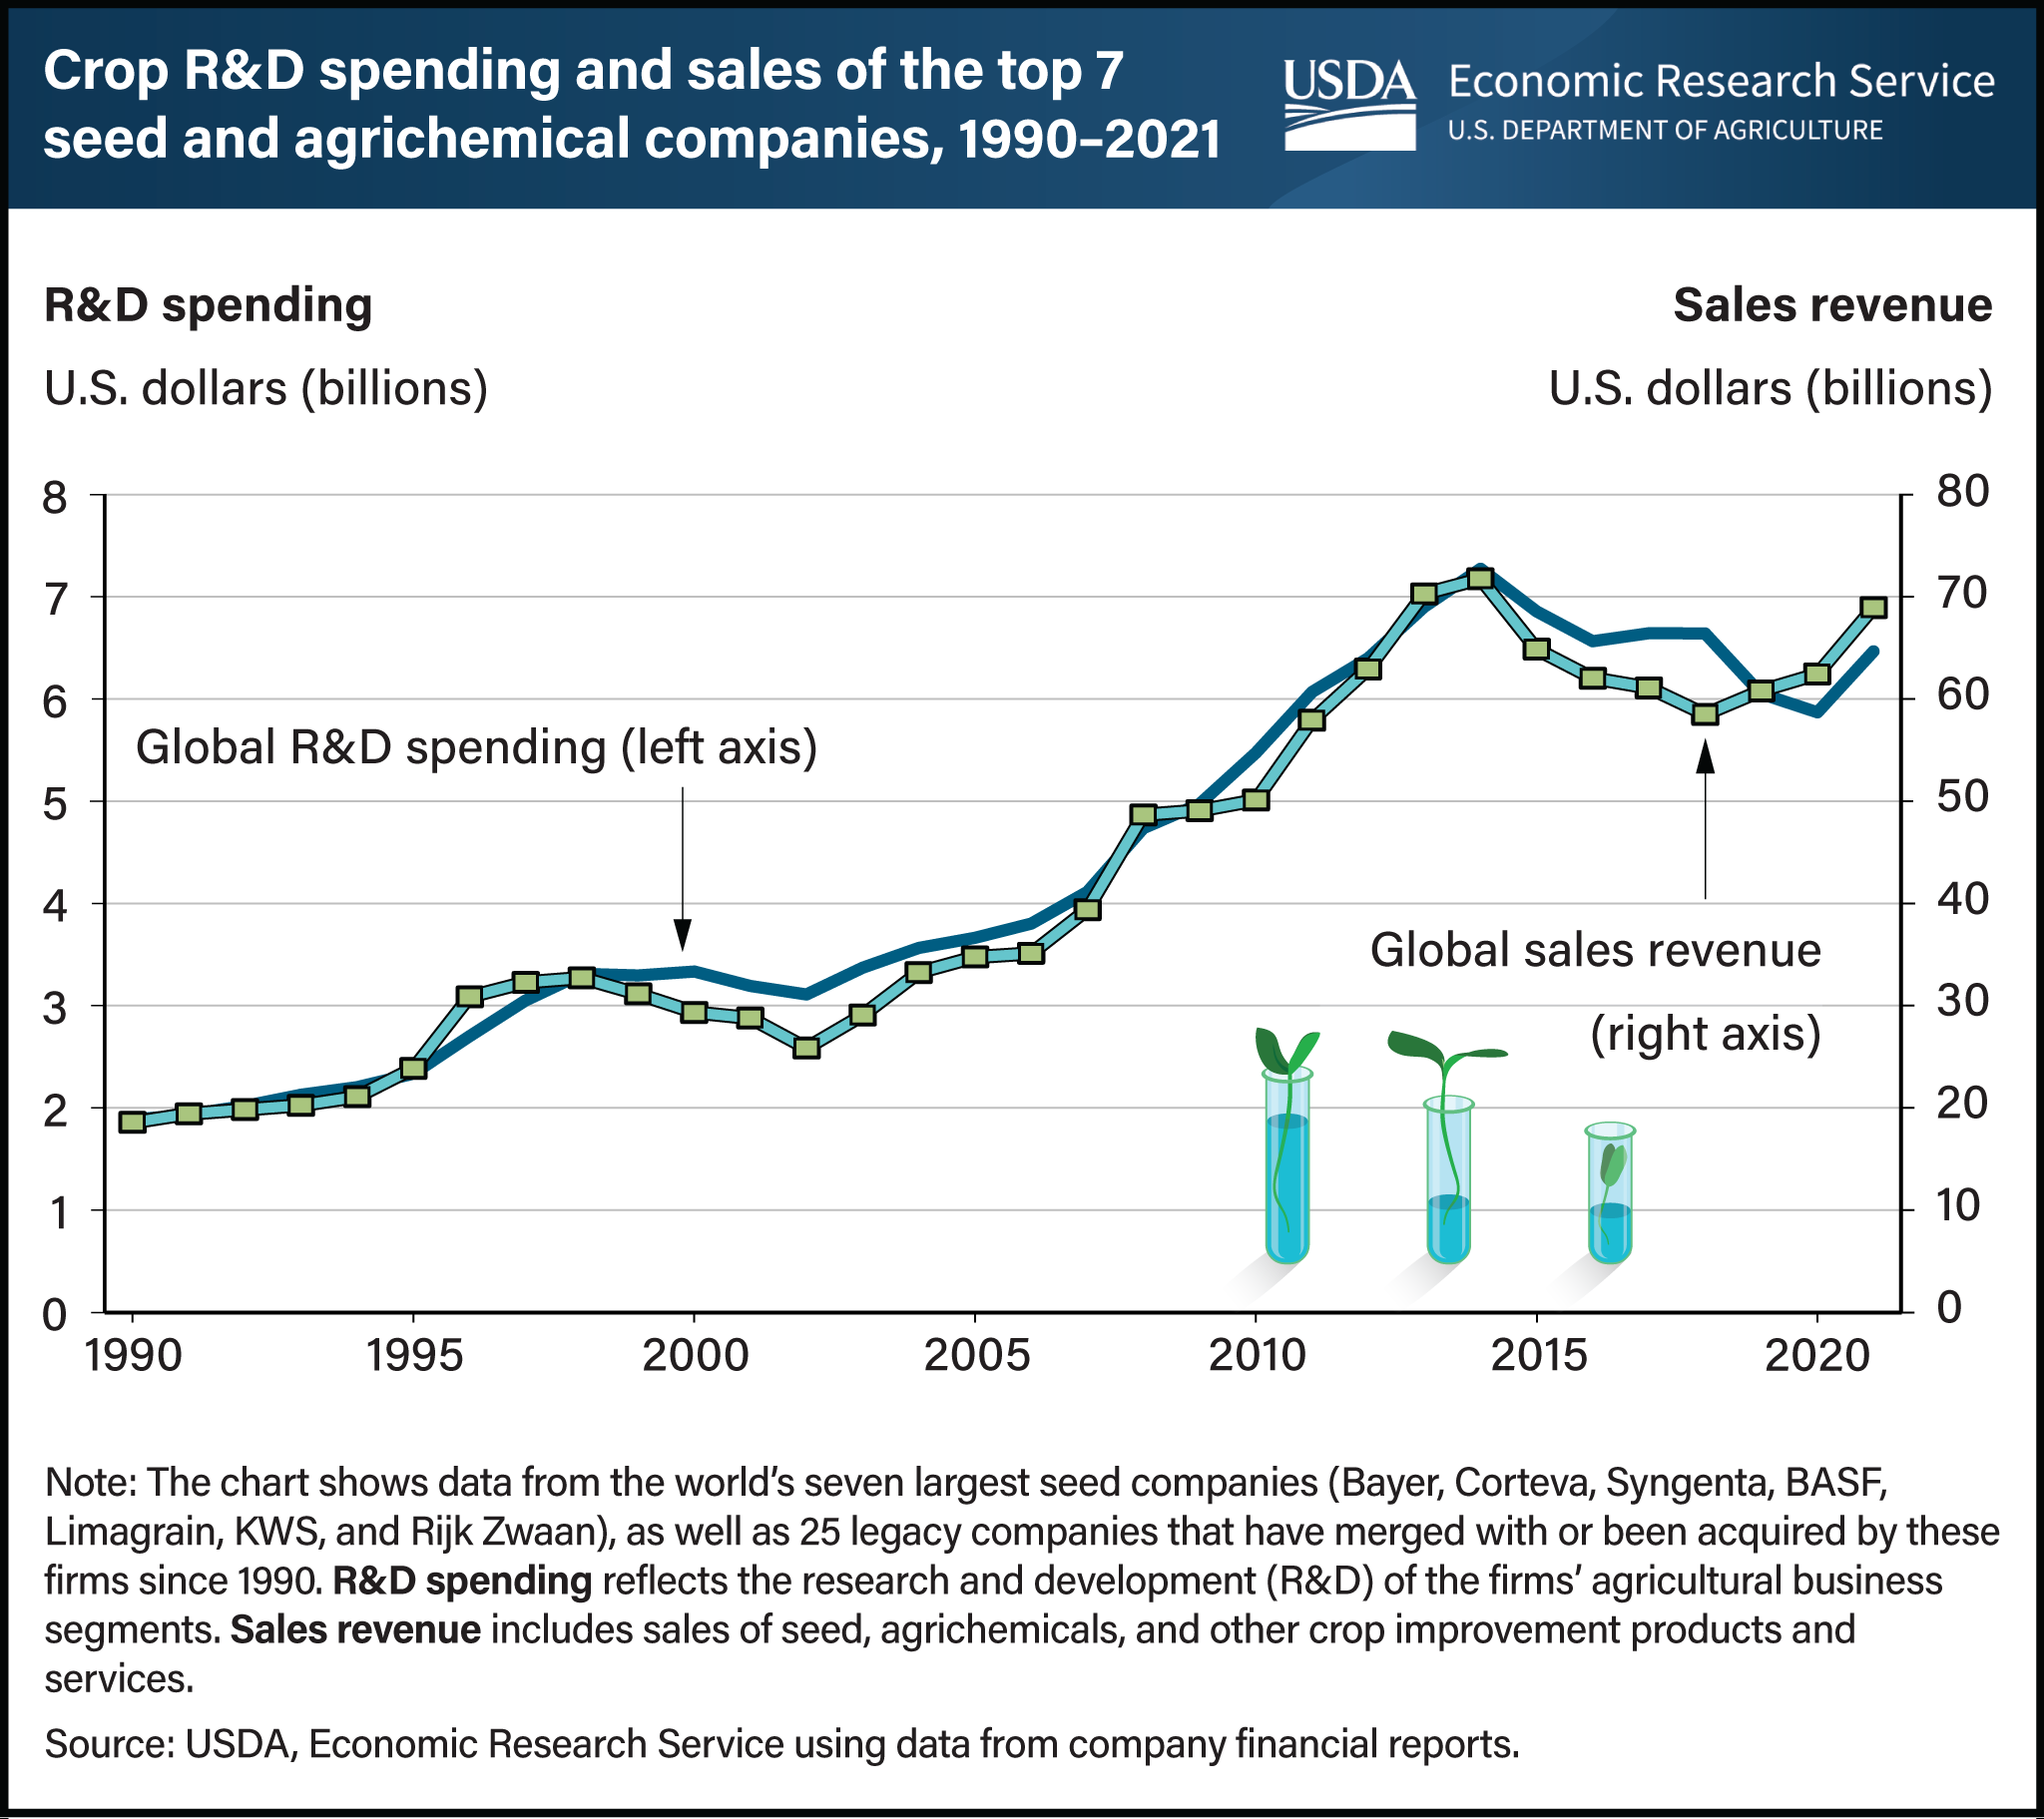
Total research and development (R&D) spending on crop improvement by the seven largest seed companies (as well as their legacy companies) increased from less than $2 billion in 1990 to more than $6.5 billion by 2021, closely tracking with increases in company revenues from seed and agrichemical sales. Intellectual property rights protections for new seed innovations—especially genetically modified seeds—allow seed companies to set prices for their products with a temporary legal monopoly. The profits earned are a return for R&D investments and costs to commercialize the inventions. These profits also allowed seed companies to spend more on crop R&D, accelerate the rate of new variety introductions with higher productivity potential, and charge higher prices reflecting the value of improved seeds. Collectively, these 7 companies have invested about 10 percent of their agricultural revenues in R&D. This chart appears in the USDA, Economic Research Service publication Concentration and Competition in U.S. Agribusiness, published in June 2023, and the Amber Waves article Expanded Intellectual Property Protections for Crop Seeds Increase Innovation and Market Power for Companies, published in August 2023.