
With domestic chili pepper production cooling off, imports have heated up
- by Seth J. Wechsler
- 9/14/2023
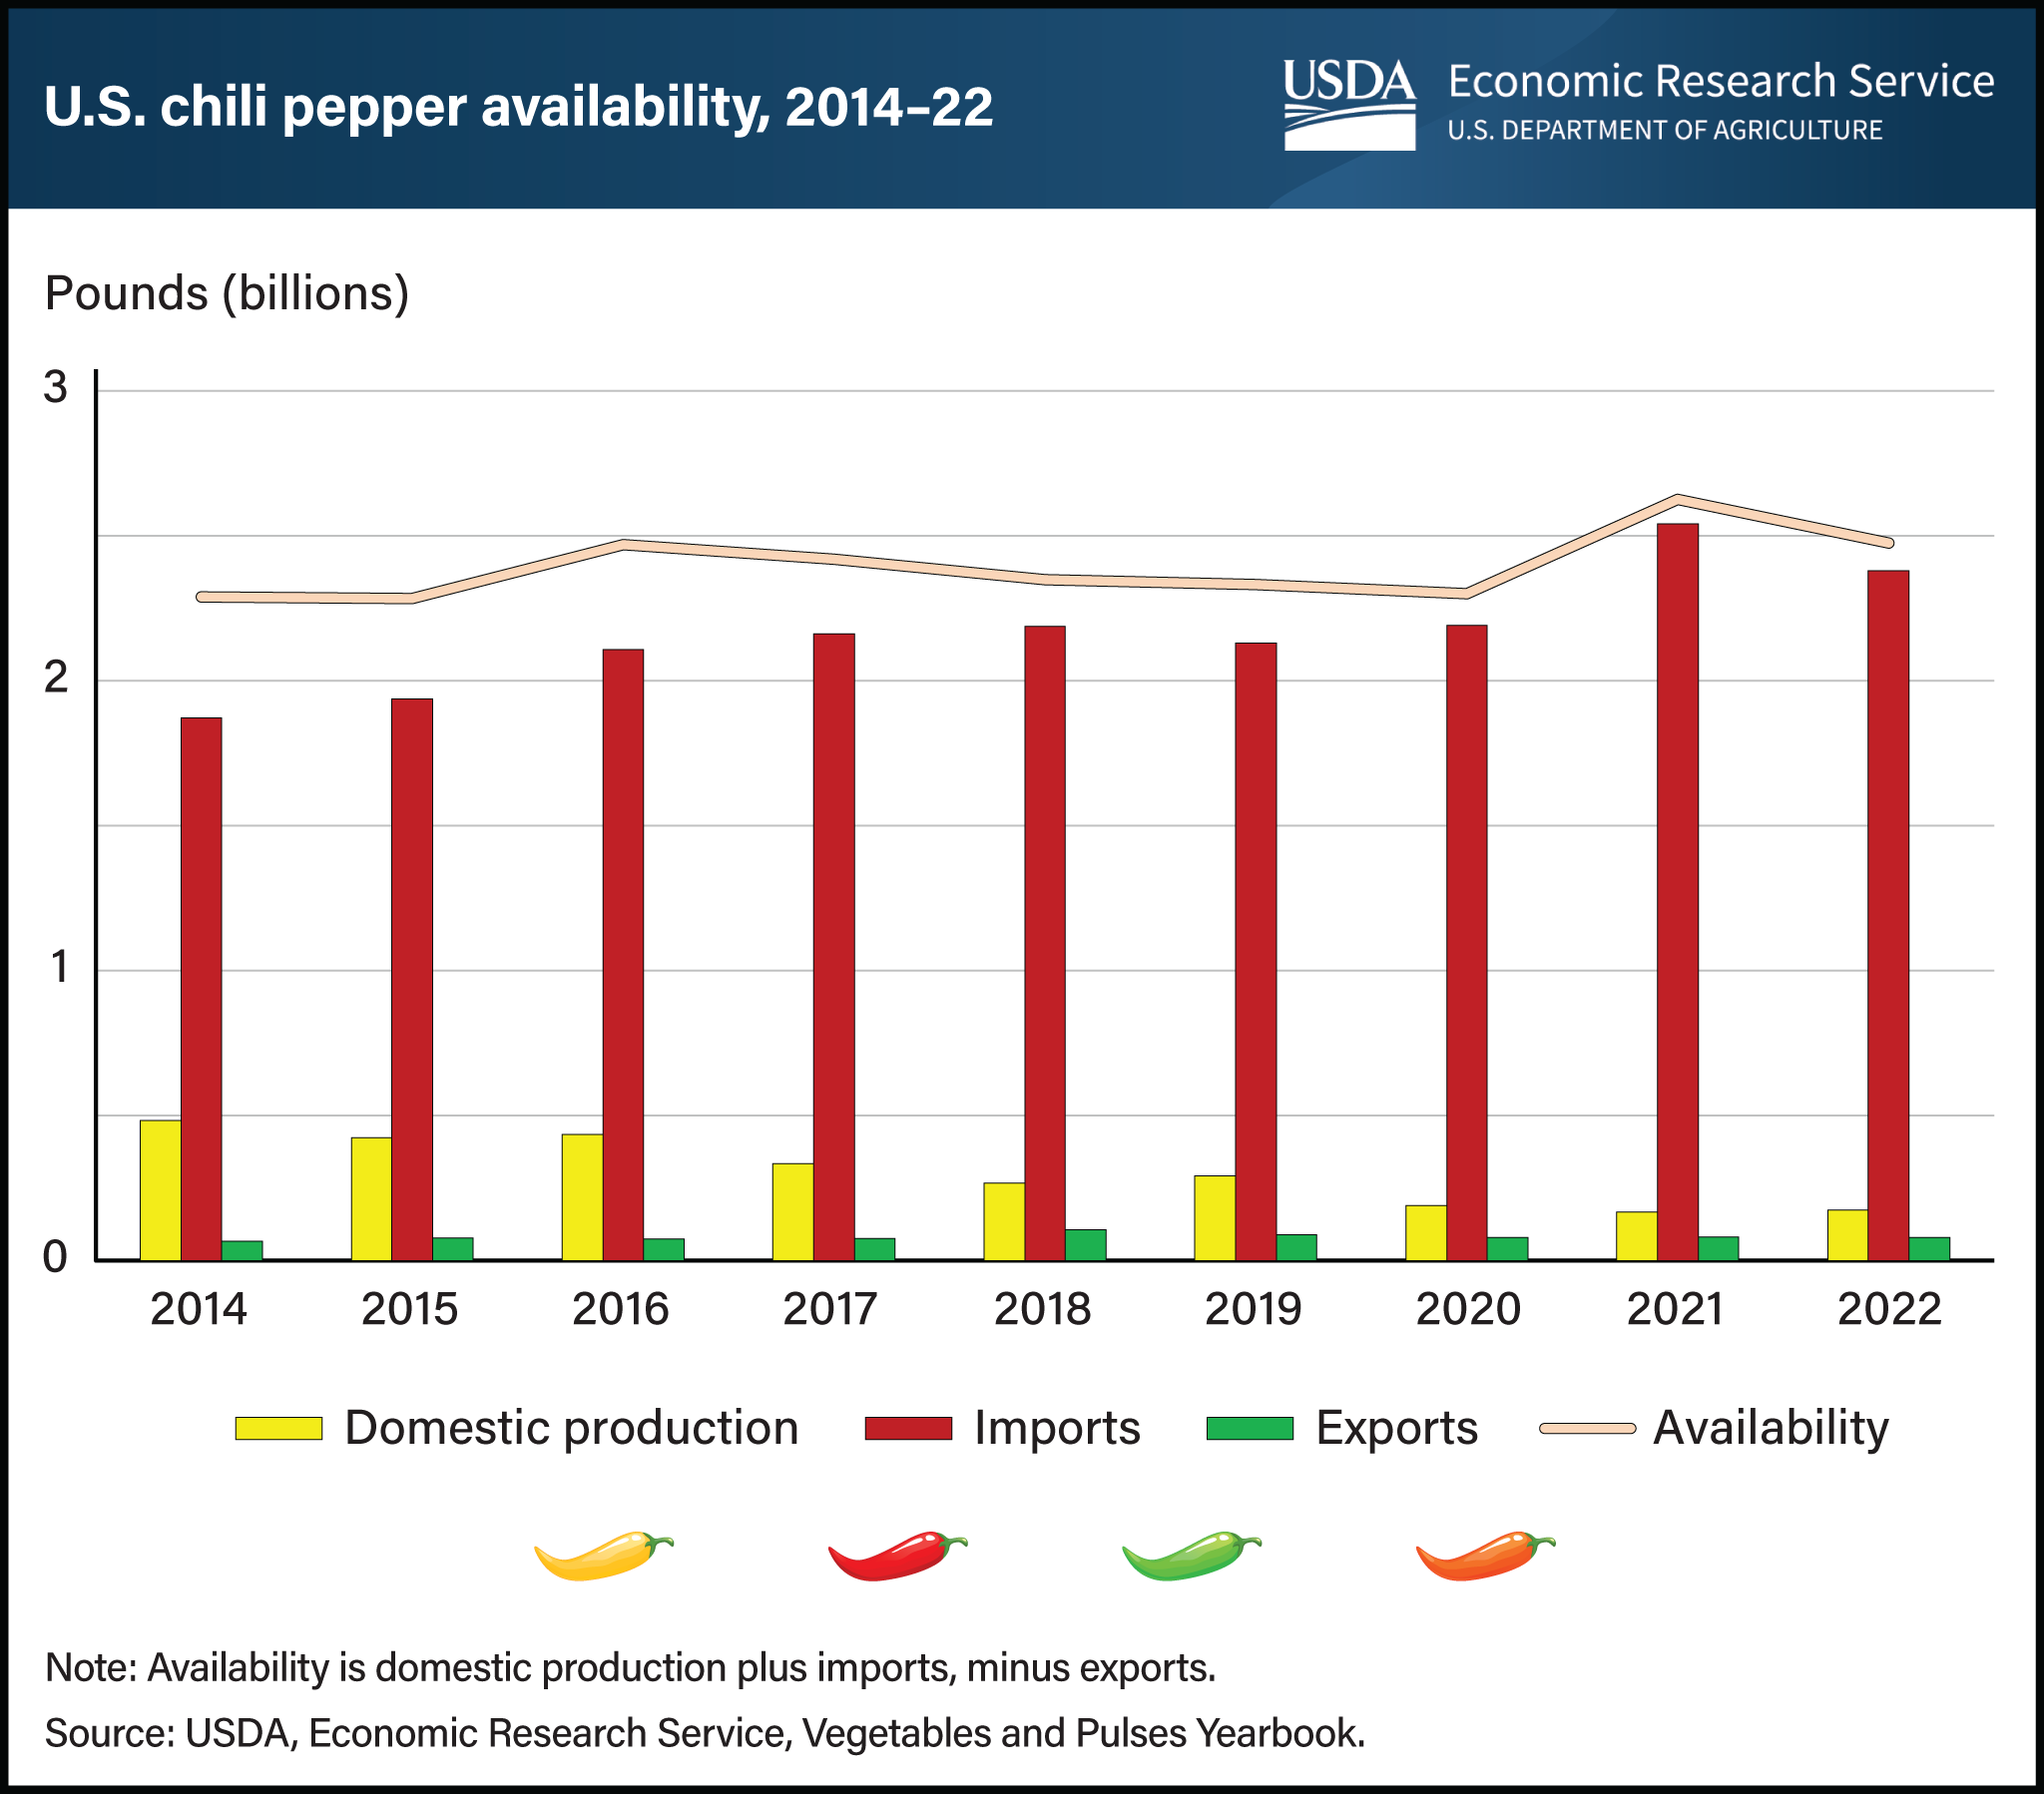
Although domestic chili pepper production has been falling for more than a decade, the rate of reduction has accelerated in recent years. In 2014, U.S. producers in Arizona, California, New Mexico, and Texas grew more than 480 million pounds of chili peppers. By 2022, production had dropped to about 175 million pounds. Generally, this 60-percent decrease can be attributed to reduced acreage and yields. To offset decreasing domestic production and to meet rising demand, many U.S. companies and consumers have purchased imported peppers, most of which are grown in Mexico. In 2014, about 2 out of every 10 chili peppers consumed domestically were produced domestically. By 2022, this share had fallen to less than 1 out of every 10. From 2014 to 2022, the number of peppers exported remained steady, ranging from 66 million pounds to 106 million. However, the share of U.S. peppers exported more than tripled, increasing from 14 percent in 2014 to 46 percent in 2022. Although 8 percent more chili peppers were available in 2022 than in 2014, fewer were grown by U.S. producers. This chart is drawn from USDA, Economic Research Service’s Vegetables and Pulses Yearbook.