
Over the next decade, crop prices are projected to decline while livestock prices generally rise
- by Matthew Miller and Brian Williams
- 11/17/2021
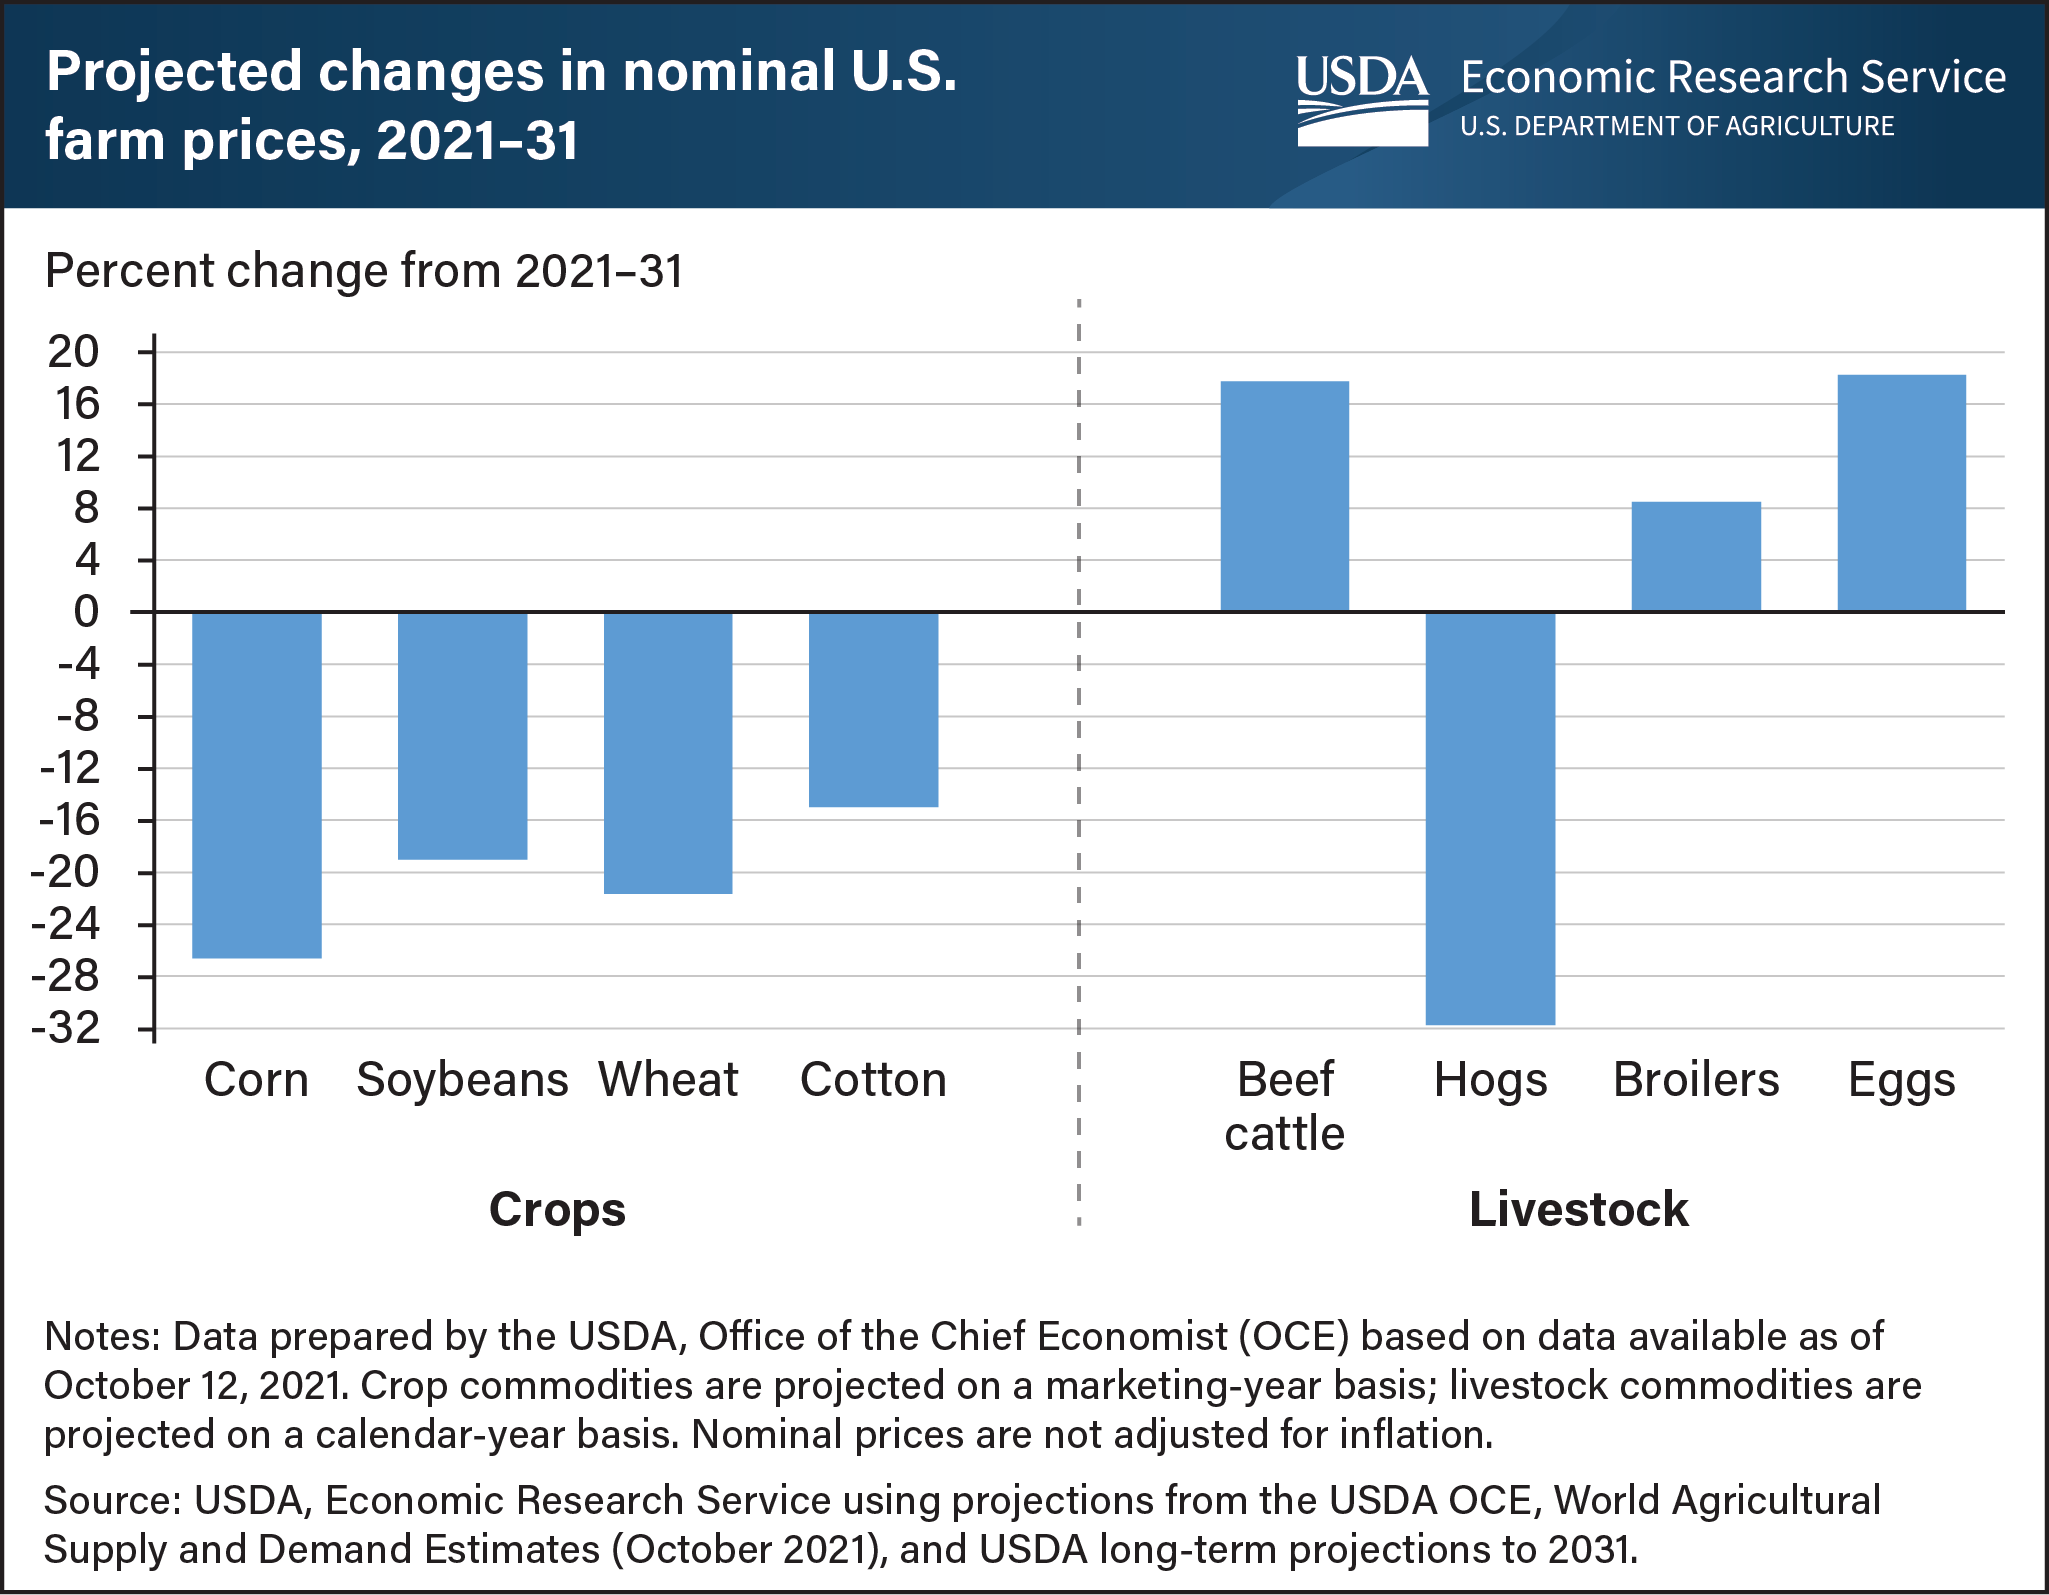
Recently released USDA projections reveal expectations for U.S. crop prices to decrease over the next 10 years while prices for major animal products, except hogs, are forecast to increase. Expected declines for crops follow a period of generally higher prices that have peaked during the current marketing year. The price-bolstering effects of economic recovery, renewed export demand, and logistical problems in supply chains are forecast to subside after the recent peak during the 2021/22 marketing year, and crop prices are forecast subsequently to return to the earlier pattern of generally lower prices through 2031. Hog prices are projected to follow a similar pattern to crops and to move toward levels that reflect normal weather and an absence of major market shocks including policy changes. Beef cattle and broiler prices are expected to demonstrate a modest increase in the early years of the projection period before leveling off to slower growth, resulting in an average price increase of 8 to 17 percent over the decade. Similar to most animal products prices, prices that farmers are expected to receive for their eggs are forecast to rise steadily throughout the projection period, partly based on increased demand for cage-free eggs and regulatory changes that are projected to increase costs of production. This chart is based upon forecasts and projections using data available as of October 12, 2021, and long-term projections to 2031 released on November 5, 2021. Current projections are shown in the Economic Research Service’s (ERS) Agricultural Baseline Database. For 2020’s farm price projections, see the ERS Chart of Note from November 9, 2020.