COVID-19 Federal financial assistance to U.S. farms varied by State
- by Okkar Mandalay and Jessica E. Todd
- 5/7/2021

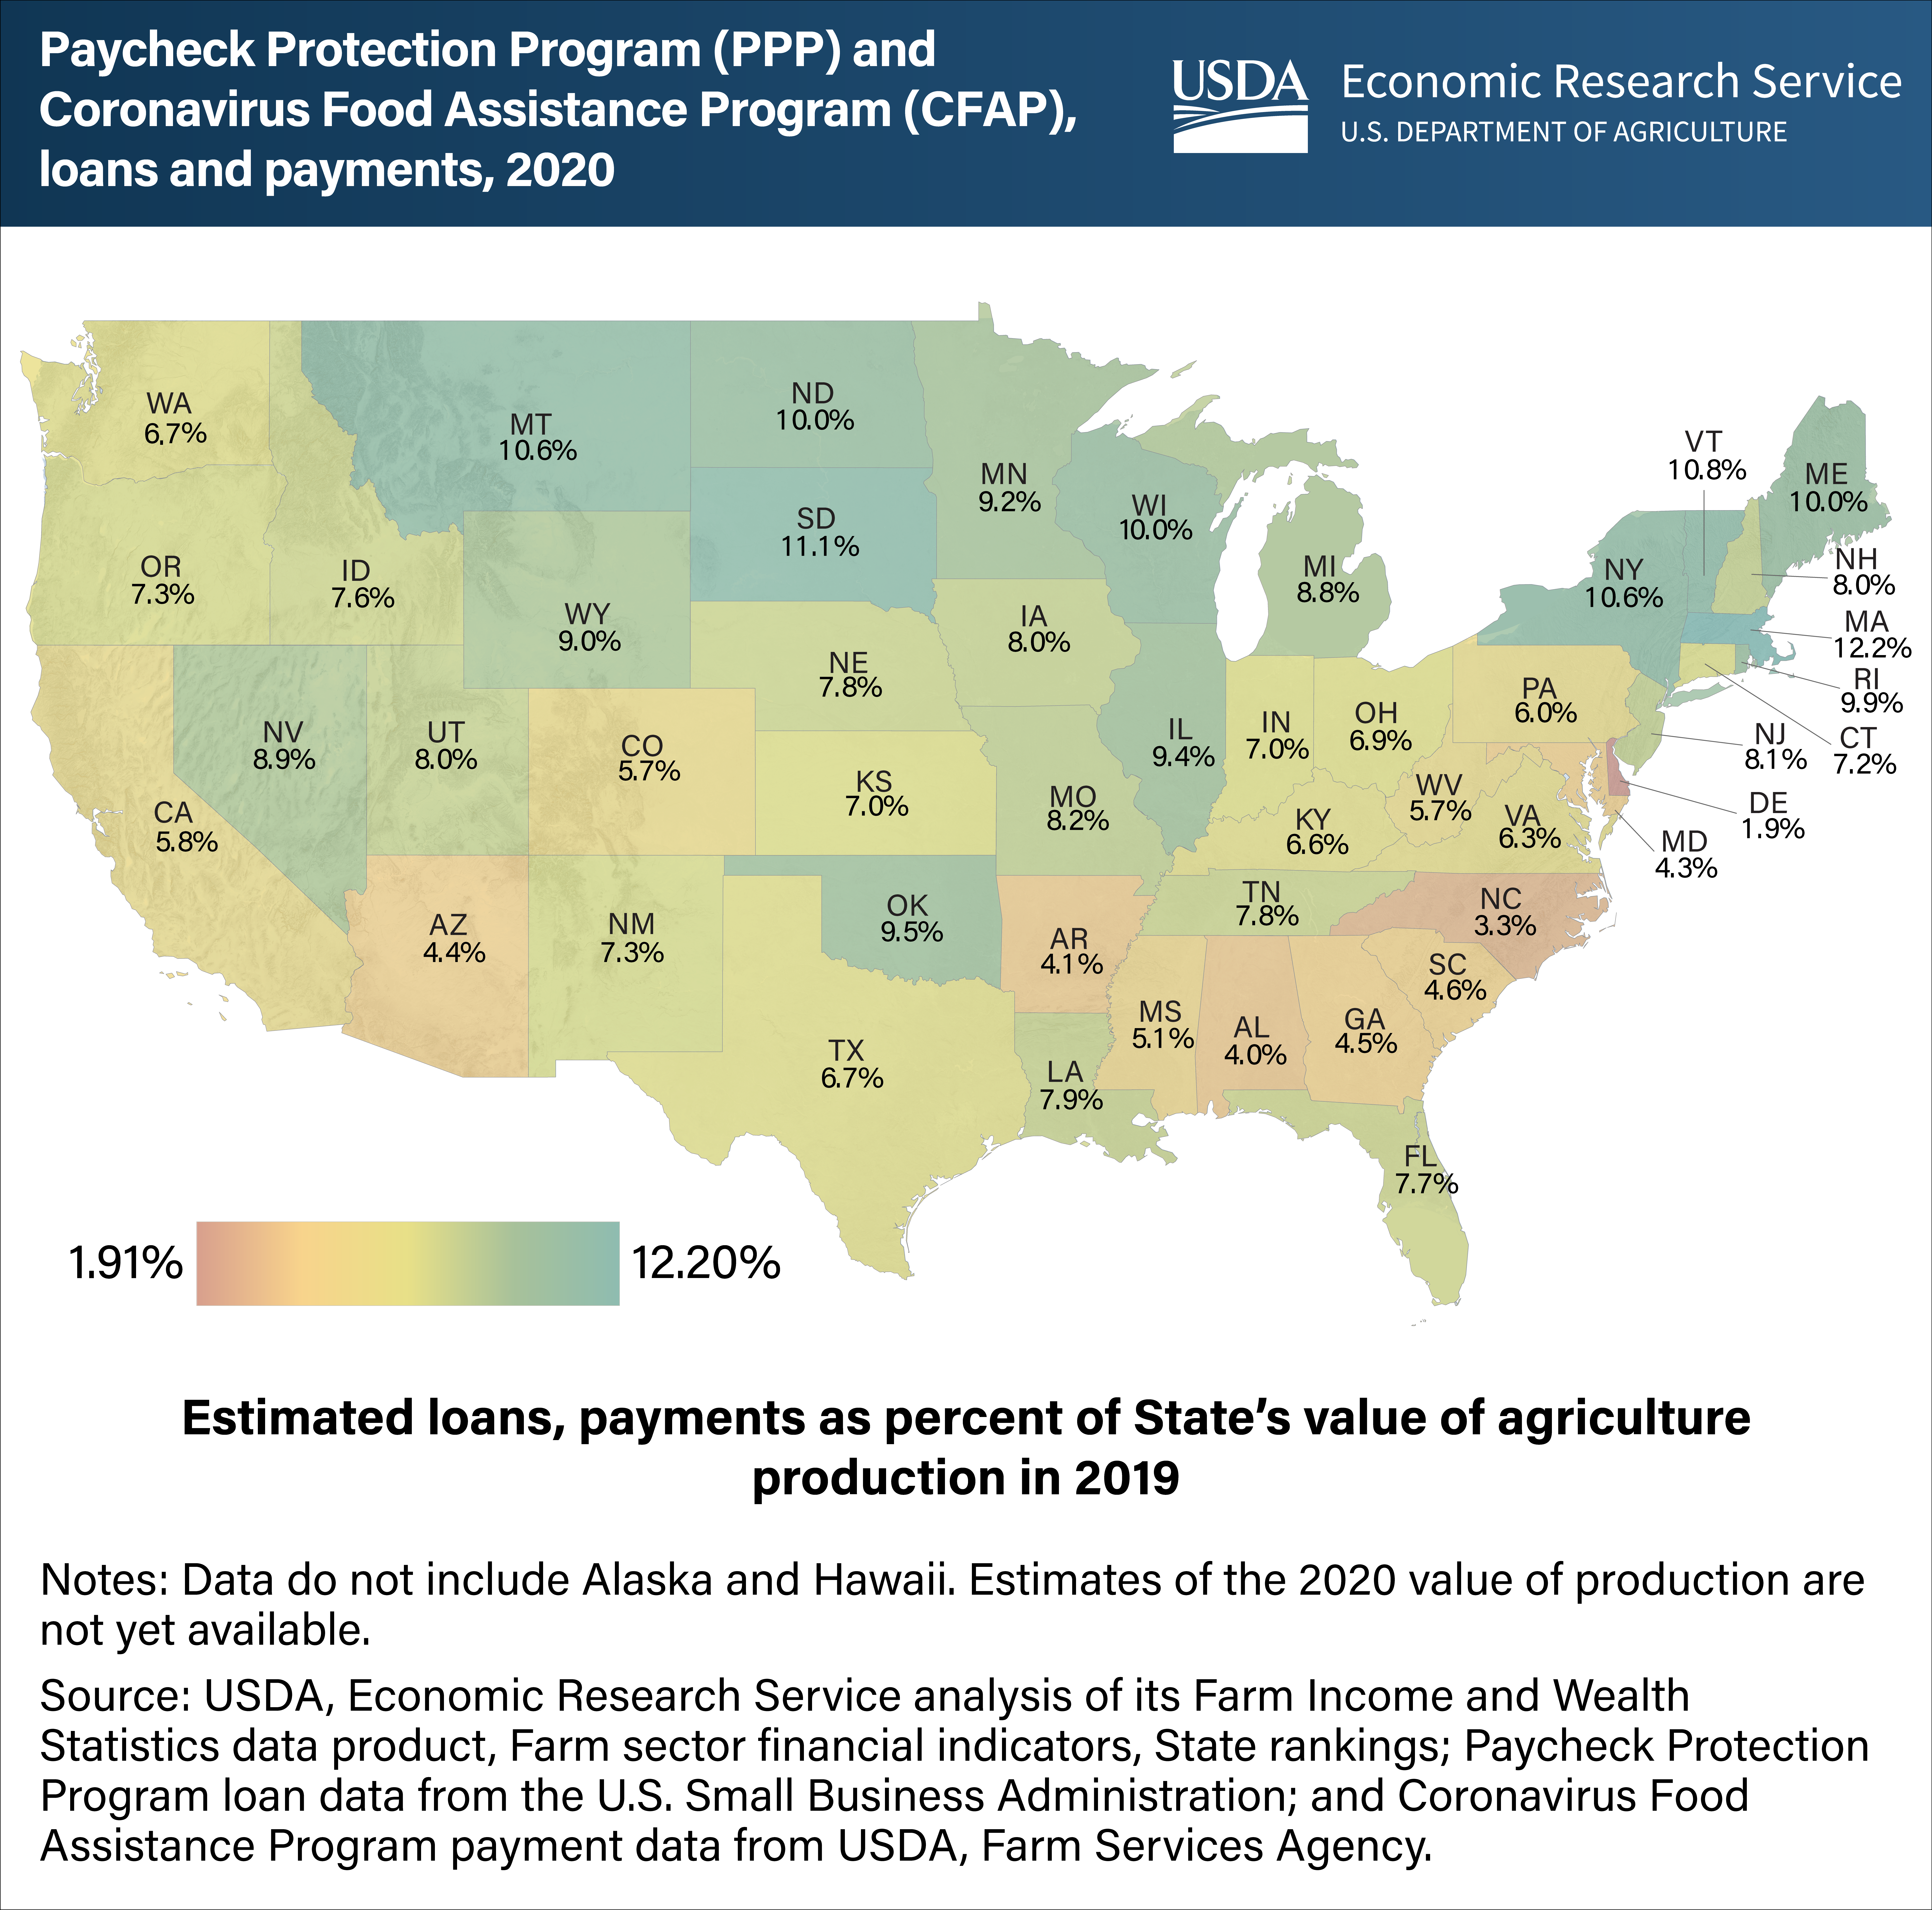
In 2020, the Federal Government provided assistance to farm operations that experienced losses because of the Coronavirus (COVID-19) pandemic. The aid came in the form of loans from the Paycheck Protection Program (PPP) and payments from the two iterations of the Coronavirus Food Assistance Program (CFAP), programs 1 (CFAP 1) and 2 (CFAP 2). PPP, administered by the U.S. Small Business Administration, provided loans to small businesses to help them keep their workers employed during the pandemic. CFAP, administered by USDA’s Farm Service Agency, provides assistance to agricultural producers whose operations were directly affected by the pandemic. The PPP loan amount each farm business could receive depended on their income and employment costs, while CFAP payments were based on commodity prices, previous sales, acres, and/or inventory. USDA, Economic Research Service (ERS) researchers compared the total amount of PPP loans plus CFAP payments received in each State in 2020 to its 2019 value of production (estimates of the 2020 value of production are not yet available). Massachusetts received the largest share of total loans and payments relative to the State’s 2019 value of production (12.2 percent), and South Dakota came in second at 11.1 percent of its 2019 production. California, which had the highest value of agricultural production in 2019, received the largest total amount of PPP and CFAP aid at $3.1 billion. Iowa, which had the second highest level of agricultural production in 2019, was No. 2 with $2.4 billion in assistance. This chart used data found in the ERS data product Farm Income and Wealth Statistics, Farm sector financial indicators, State rankings, updated February 2021.

