
As of August, food-at-home prices in 2020 were above 2019 levels
- by Carolyn Chelius
- 9/30/2020
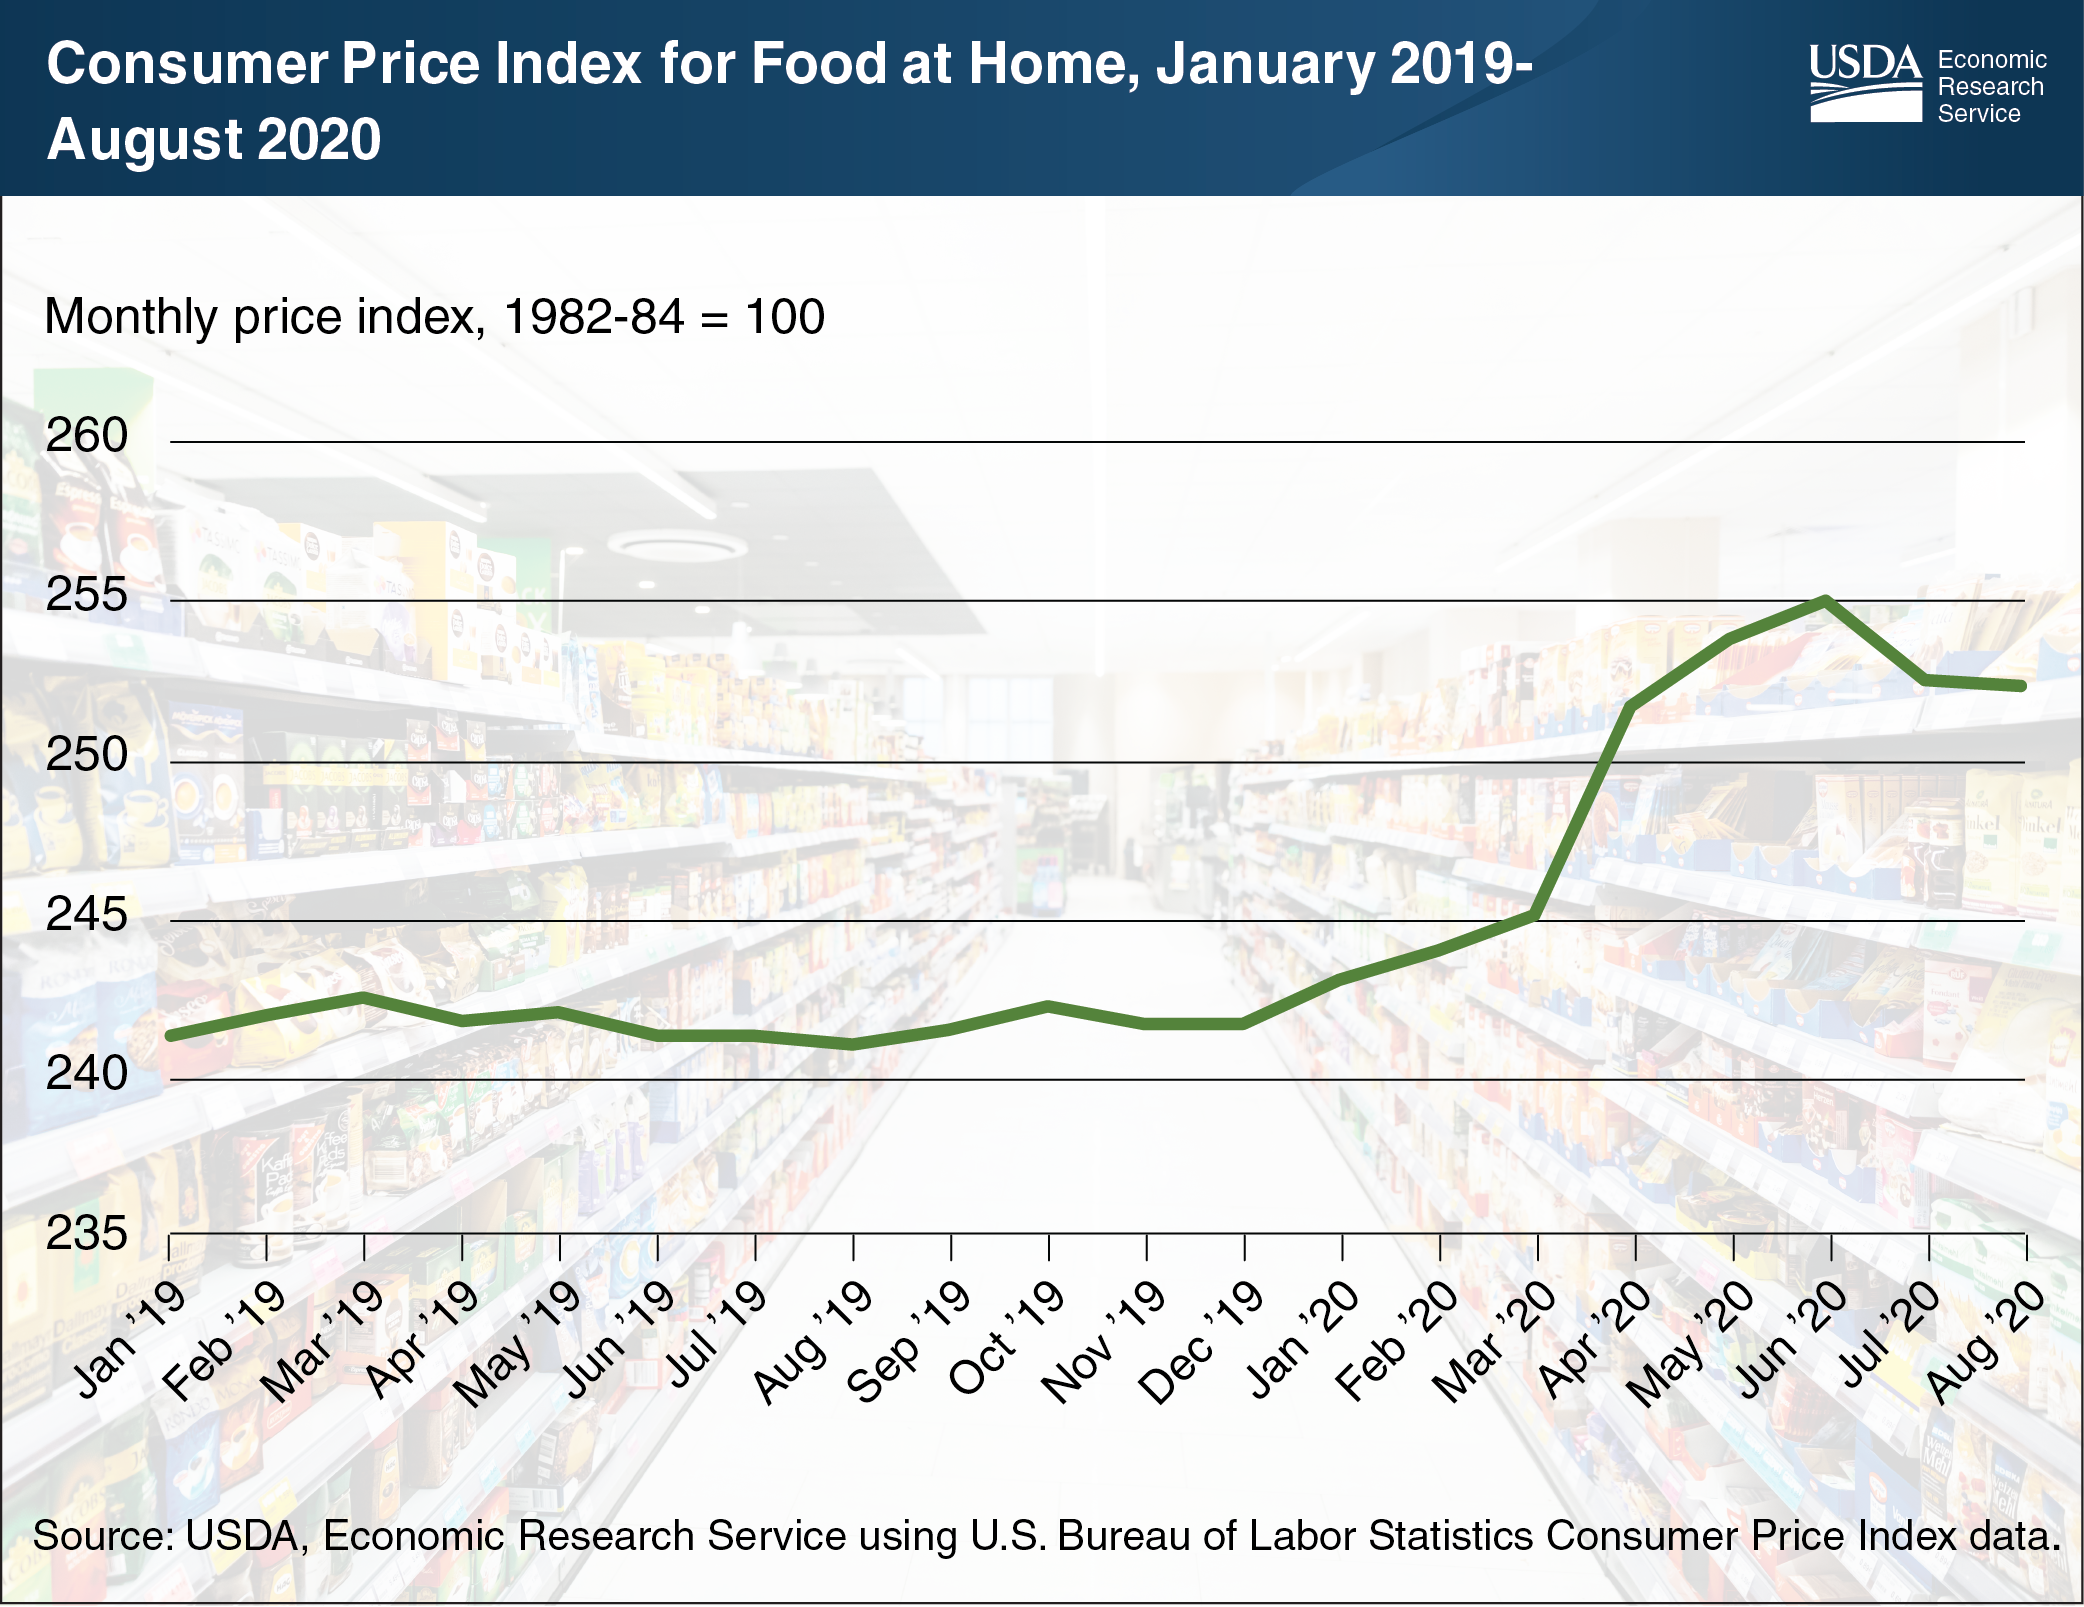
Grocery store food prices—or food-at-home prices—were 4.6 percent higher in August 2020 than a year earlier. Changes in food-at-home prices are measured by the Consumer Price Index (CPI) for Food at Home. The CPI for Food at Home looks at prices for a specific set of grocery store foods and beverages bought in cities around the country and compares the price of this “market basket,” or indexes it, to 1982-84 prices. Indexing provides information on cumulative changes in food prices over time, answering the question: How much higher are food prices this year compared with last year or past years? Over January to December 2019, the monthly price index for food at home ranged from 241.2 to 242.6, indicating prices rose or fell by no more than 0.6 percent per month. Monthly food-at-home prices in 2020 display a different pattern. Food-at-home prices rose by an average of 0.5 percent in January, February, and March, followed by a jump of 2.7 percent in April and a continued rise in May and June. In July and August, prices fell by 1.0 and 0.1 percent, respectively. Even so, food-at-home prices remained higher than during the previous year. For context, annual inflation for food at home has averaged around 2 percent for the past 20 years. Food-at-home prices in 2020 were influenced by the coronavirus pandemic. The pandemic put pressure on several food industries, disrupting supply chains for commodities including dairy, beef, pork, and poultry. For a closer look at specific food categories, explore the Economic Research Service (ERS) Chart of Note on retail price changes between June 2019 and June 2020. The data for both charts come from the ERS’s Food Price Outlook data product.
We’d welcome your feedback!
Would you be willing to answer a few quick questions about your experience?