
Productivity growth has contributed positively to U.S. agricultural output in all sub-periods since 1948
- by Sun Ling Wang
- 8/26/2020
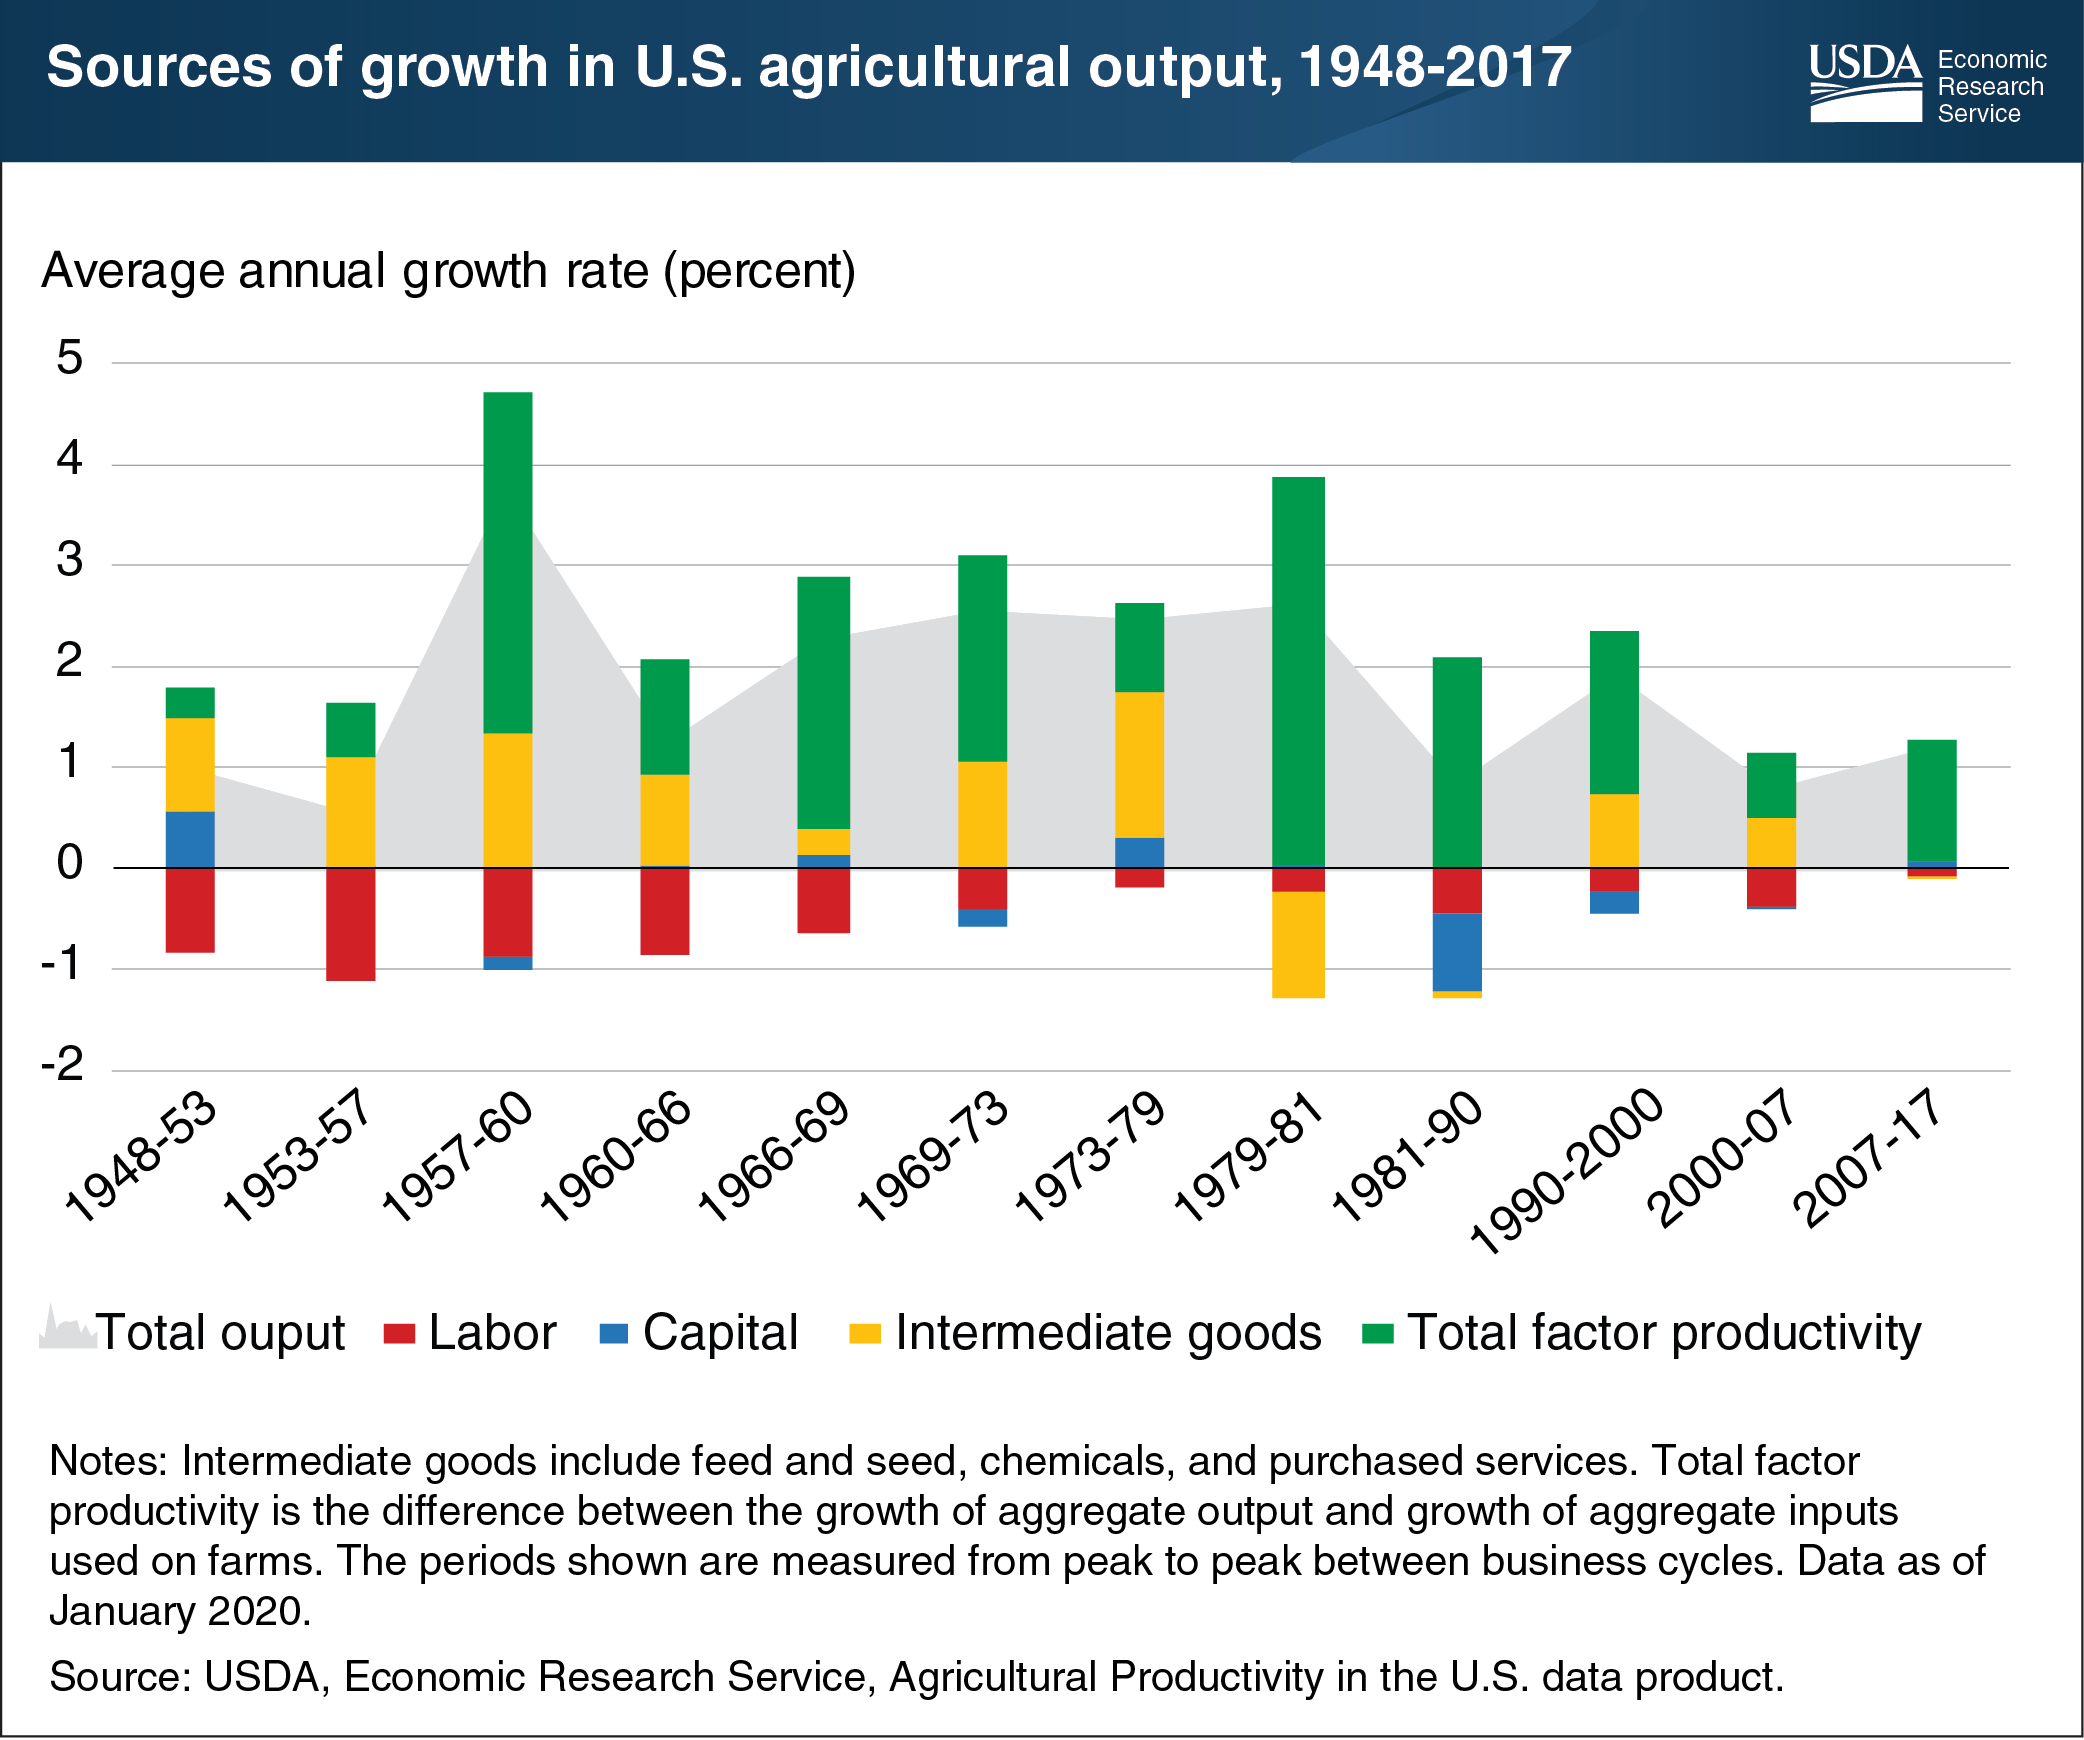
The total output—including livestock, crops, and other farm related outputs—produced by U.S. farms nearly tripled between 1948 and 2017, growing at an average annual rate of 1.53 percent. This output growth was primarily attributable to increased productivity, which grew at an average of 1.46 percent per year. Total inputs—including capital, land, labor, and intermediate goods—increased by 0.07 percent annually, by comparison. Though total input use grew slowly during this period, its composition shifted considerably. The use of intermediate goods (such as feed, seeds, and chemicals) increased by more than 130 percent, while agricultural labor declined by 76 percent and the amount of land devoted to agriculture was down by more than 25 percent. The continuing growth in intermediate goods contributed 0.58 percentage points per year to output growth, the highest among all inputs (capital, labor, and intermediate goods). However, the contribution of intermediate goods to output growth has been small (even negative in some years) since 1981. Over the long-term, productivity growth has been the major driver of agricultural growth. Productivity growth—spurred by innovations in animal and crop genetics, chemicals, equipment, and farm organization through research—is the only factor that contributed positively to agricultural growth in all sub-periods (measured from peak to peak between business cycles) since 1948. This chart appears in the July 2020 Amber Waves article, “Productivity Is the Major Driver of U.S. Farm Sector’s Economic Growth.”