
Food-insecure households purchase less fruit than food-secure households
- by Christian A. Gregory
- 2/7/2020
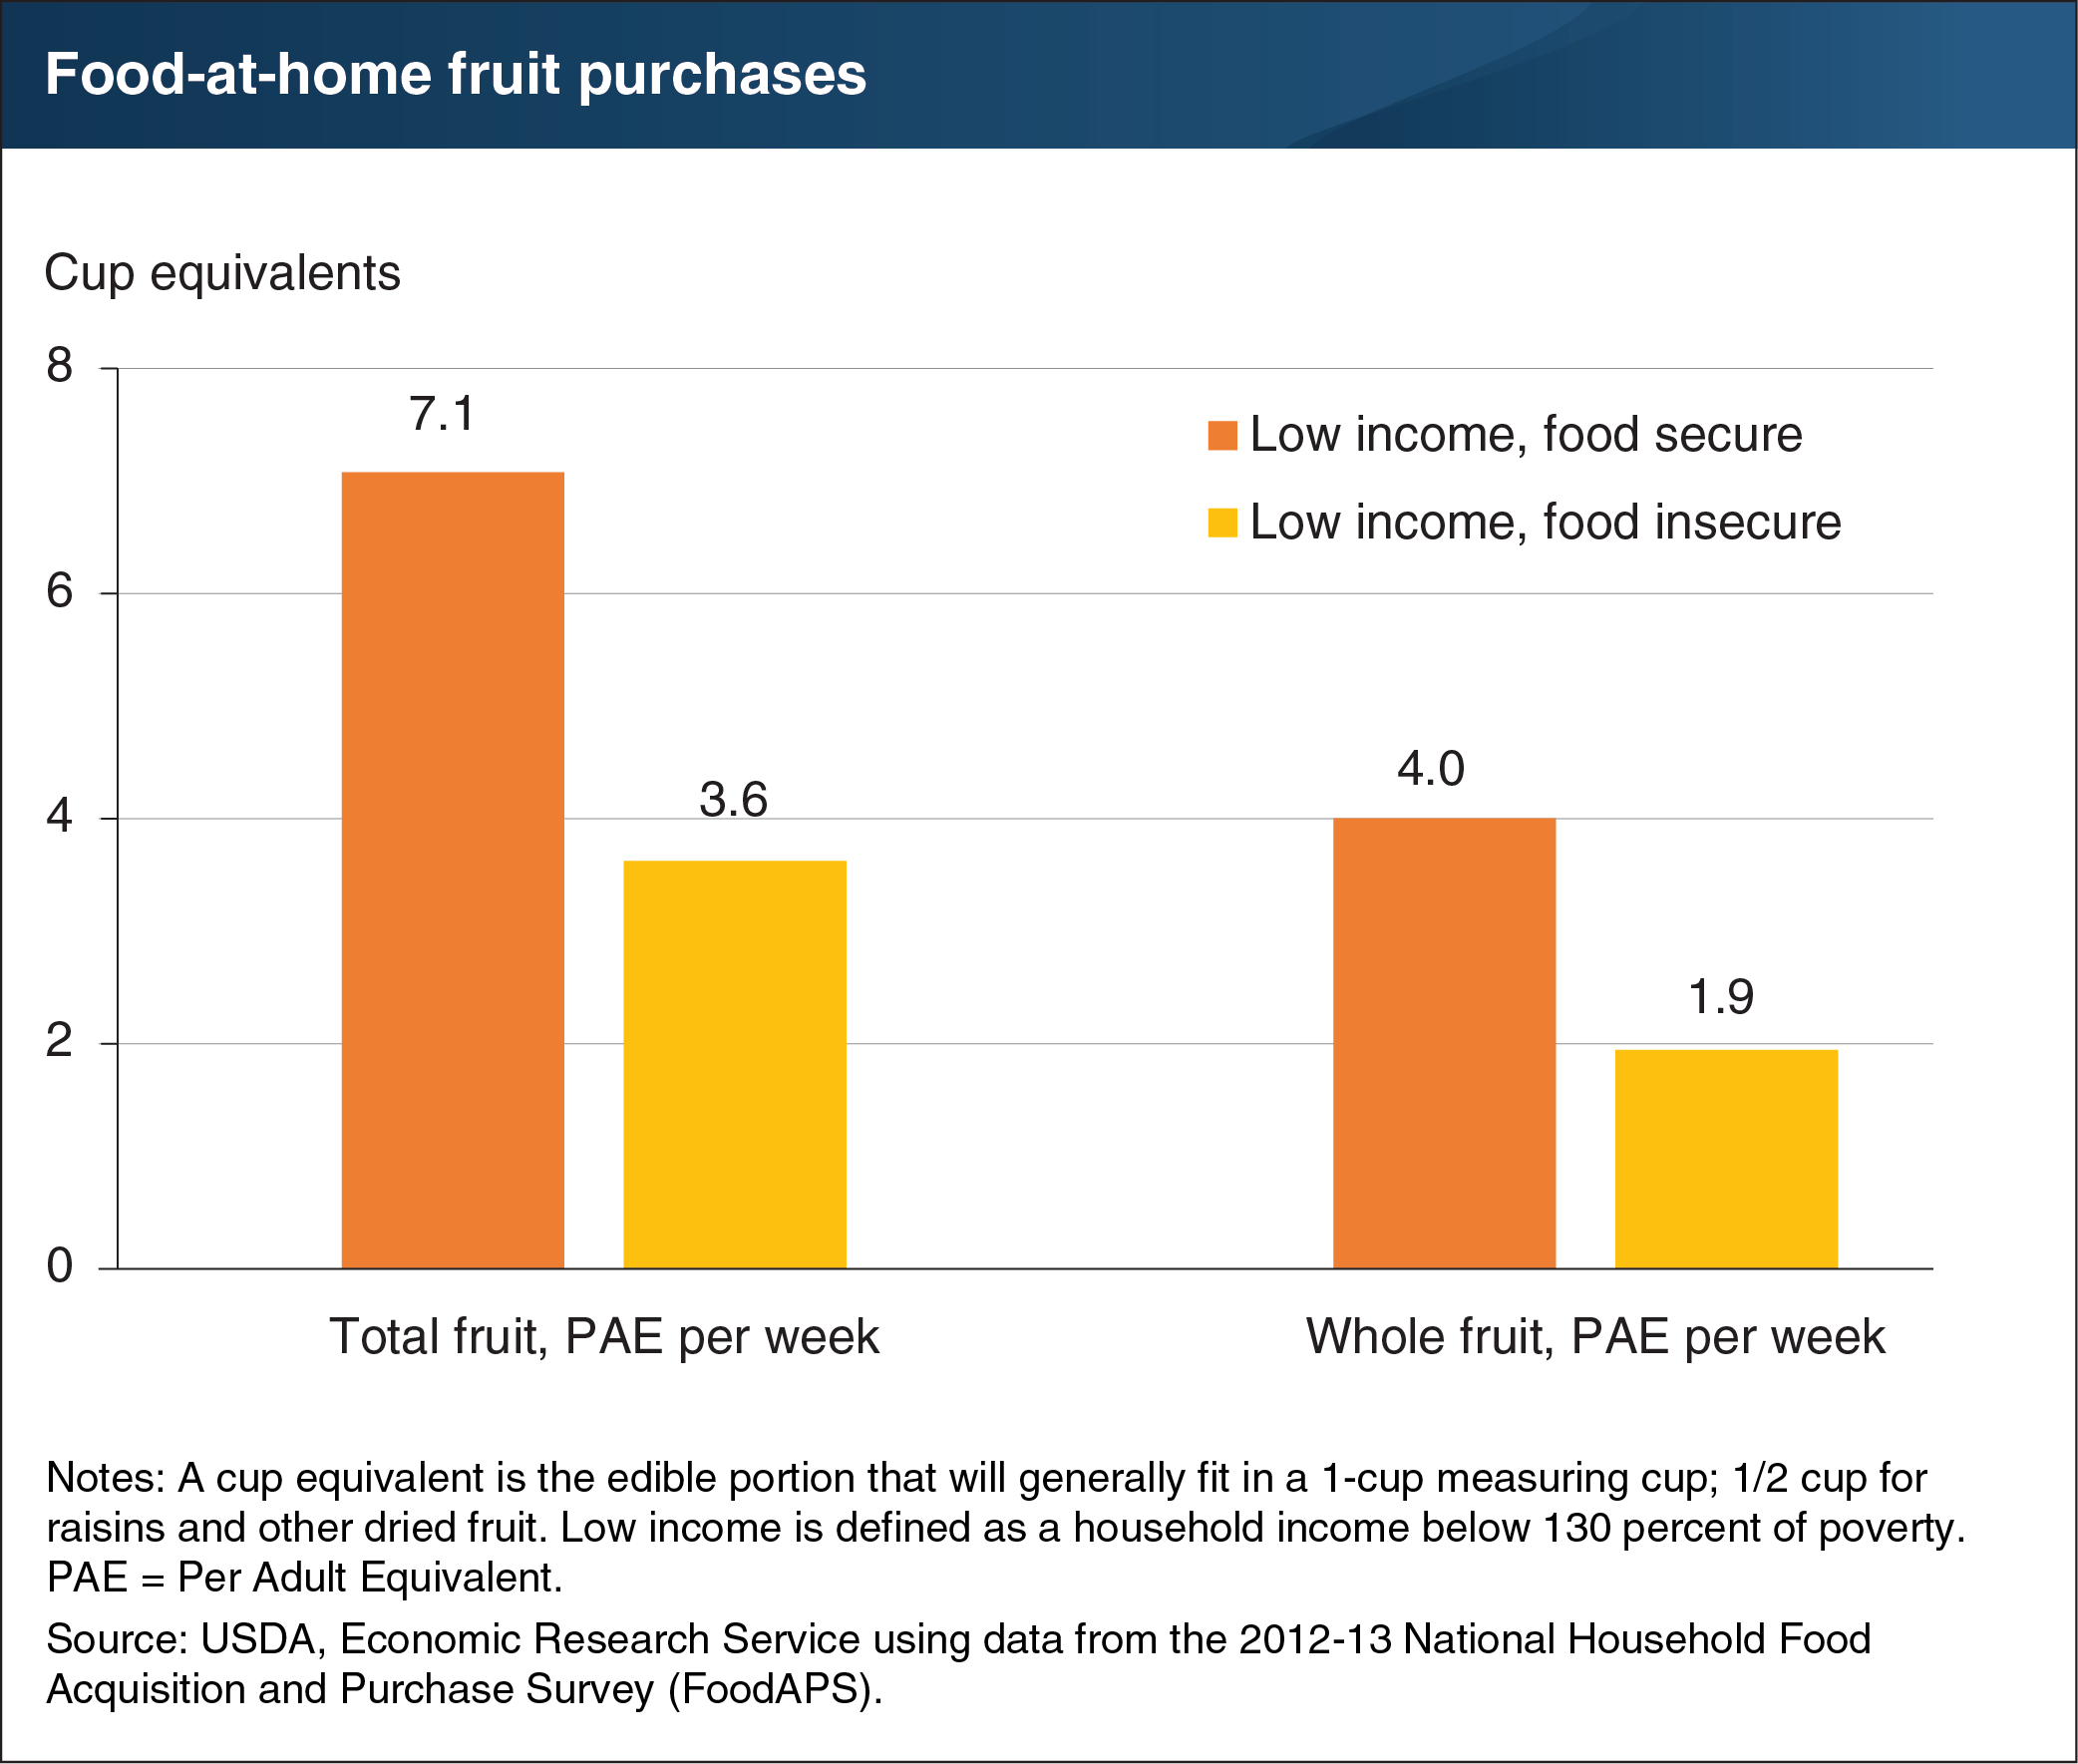
ERS researchers used data from USDA’s National Household Food Acquisition and Purchase Survey (FoodAPS) to examine purchases of fruit from supermarkets, supercenters, convenience stores, and other retailers (food-at-home purchases) by two groups of low-income households: food-secure and food-insecure households. Food-secure households have consistent, dependable access to enough food for active, healthy living; food-insecure households do not. The researchers looked at total fruit purchases (whole and juices) and whole fruit purchases. They converted household purchases to “per adult equivalents,” where household members are scaled by daily calorie requirements based on their age and sex using 2,000 calories as an adult equivalent. The conversion accounts for differences in household size and composition. The researchers found that low-income food-secure households purchased 7.1 cup equivalents of fruit per adult equivalent per week, versus the 3.6 cups purchased by low-income food insecure households. In terms of whole fruit, food-insecure households purchased just under 2 cup equivalents per adult equivalent per week, while food-secure households purchased 4 cups per adult equivalent. This chart appears in the August 2019 ERS report, Food Security and Food Purchase Quality Among Low-Income Households: Findings From the National Household Food Acquisition and Purchase Survey (FoodAPS).