
Productivity of farms in the Heartland increased over time, but more slowly for smallest farms
- by Nigel Key and Dennis Vilorio
- 10/11/2019
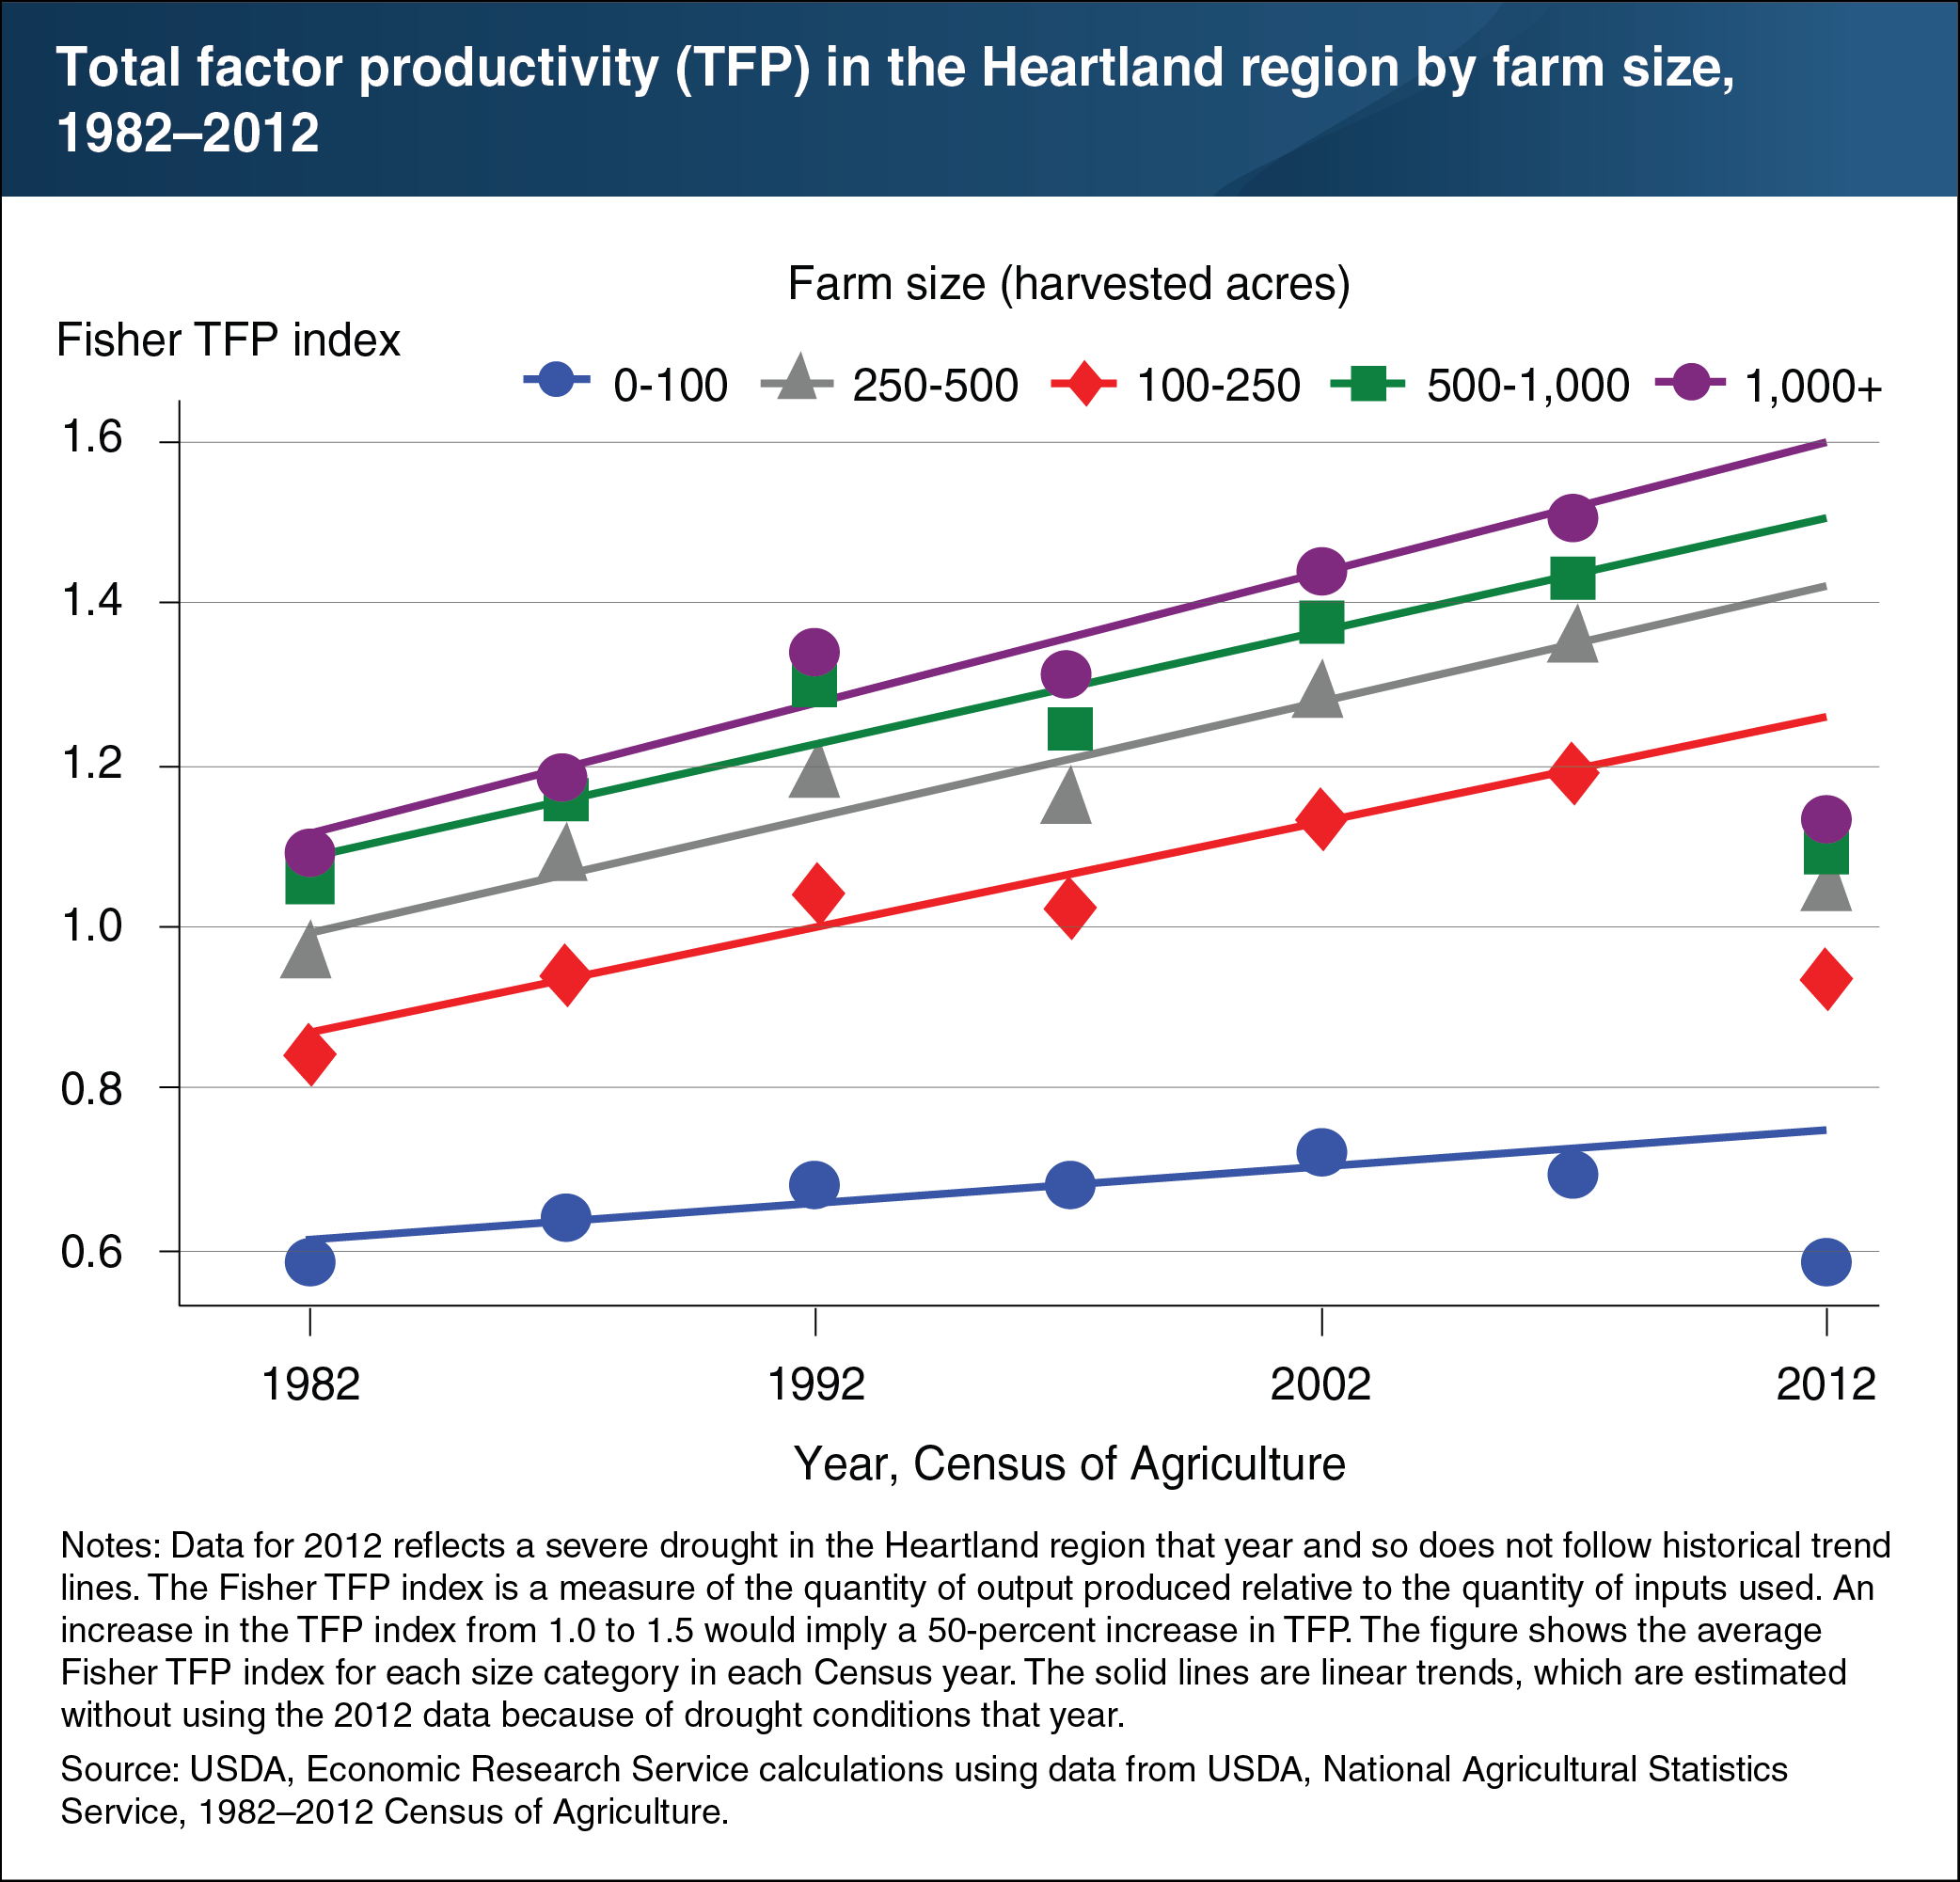
Recent ERS research examined productivity trends in the Heartland region, which includes all of Iowa, Illinois, and Indiana, and parts of Minnesota, South Dakota, Nebraska, Missouri, Kentucky, and Ohio. Findings show that the smallest crop farms (less than 100 acres) fell further behind larger farms in terms of productivity between 1982 and 2012. Total factor productivity (TFP)—a measure of the quantity of output produced relative to the quantity of inputs used—grew at similar rates across farm-size classes except for the smallest, which had slower growth rates. (However, data for 2012 reflects a severe drought in the Heartland region that year and so does not follow historical trend lines.) While the TFP for farms in the four largest size categories increased by 47 to 59 percent between 1982 and 2012, TFP for the smallest farms increased by only 17 percent. Some technological advances in recent decades, such as very large combine harvesters and precision agriculture technologies, were not as advantageous for the smallest farms to adopt due to cost. This may help explain why the farm productivity growth of the smallest farms has lagged behind that of larger operations. This trend has resulted in a deterioration of the competitive position of farms in the smallest size category, and has likely contributed to a decline in their share of total output. This chart appears in the December 2018 Amber Waves feature “Productivity Increases With Farm Size in the Heartland Region.”