
Economic conditions and program policy help drive average SNAP benefit levels
- by Laura Tiehen
- 5/3/2018
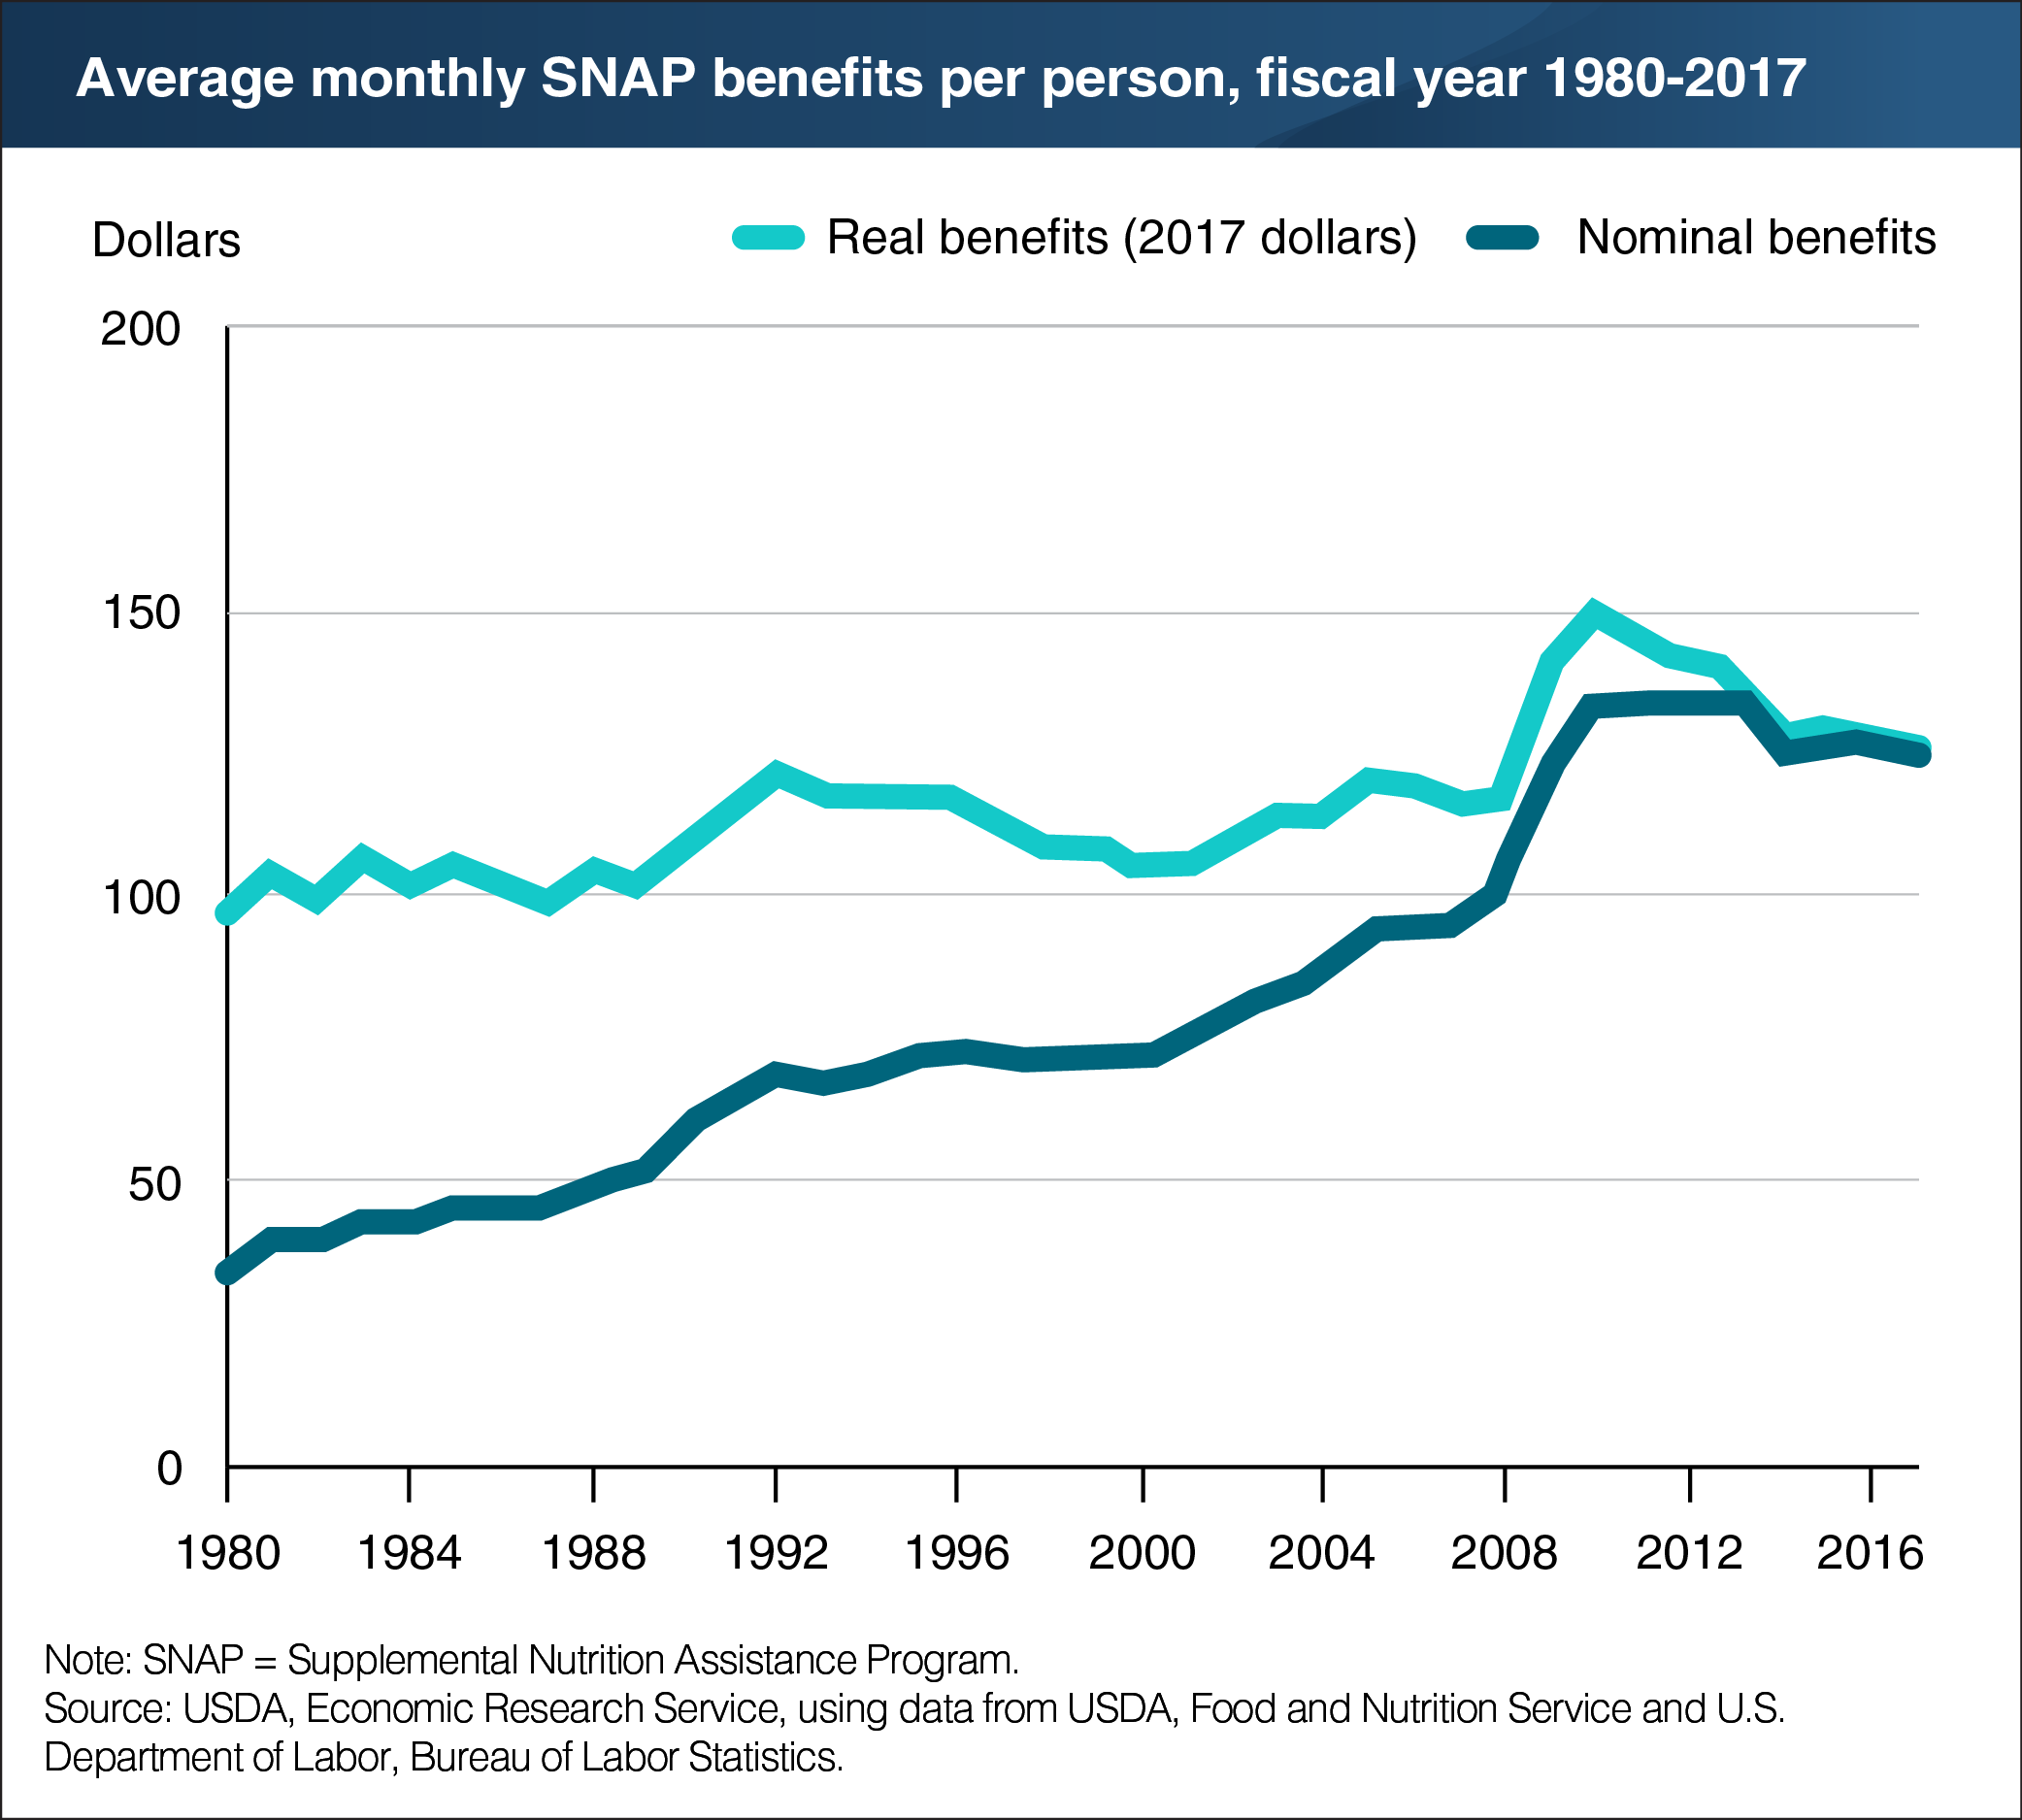
USDA’s Supplemental Nutrition Assistance Program (SNAP) provides low-income households with monthly benefits to supplement their resources for purchasing food. Benefit amounts increase with household size and decrease with household income. Between 1980 and 2017, average monthly benefits grew from $34 per person to $126 per person. Much of this increase reflects the fact that SNAP benefit levels are updated annually for food price inflation so that their purchasing power does not erode. However, even when benefits are adjusted for inflation, average per person benefits rise and fall as characteristics of SNAP households, such as income, change in response to economic conditions and policy changes. Measured in 2017 dollars to adjust for inflation, average monthly SNAP benefits increased from $99 per person in 1980 to $119 in 2008. The 2009 American Recovery and Reinvestment Act (ARRA) provided all recipients with increased SNAP benefits, and average inflation-adjusted SNAP benefits jumped to $143 per person in that year, climbed to $152 in 2010, and then began falling as the ARRA increase was phased out and economic conditions improved. Inflation-adjusted and nominal benefit amounts have been similar in the past few years, as food price increases have been small. This chart appears in ERS’s Supplemental Nutrition Assistance Program (SNAP) topic page.