
Number of chain grocery stores increased from 2005 to 2015, while number of independent grocery stores showed little growth
- by Clare Cho
- 11/28/2017
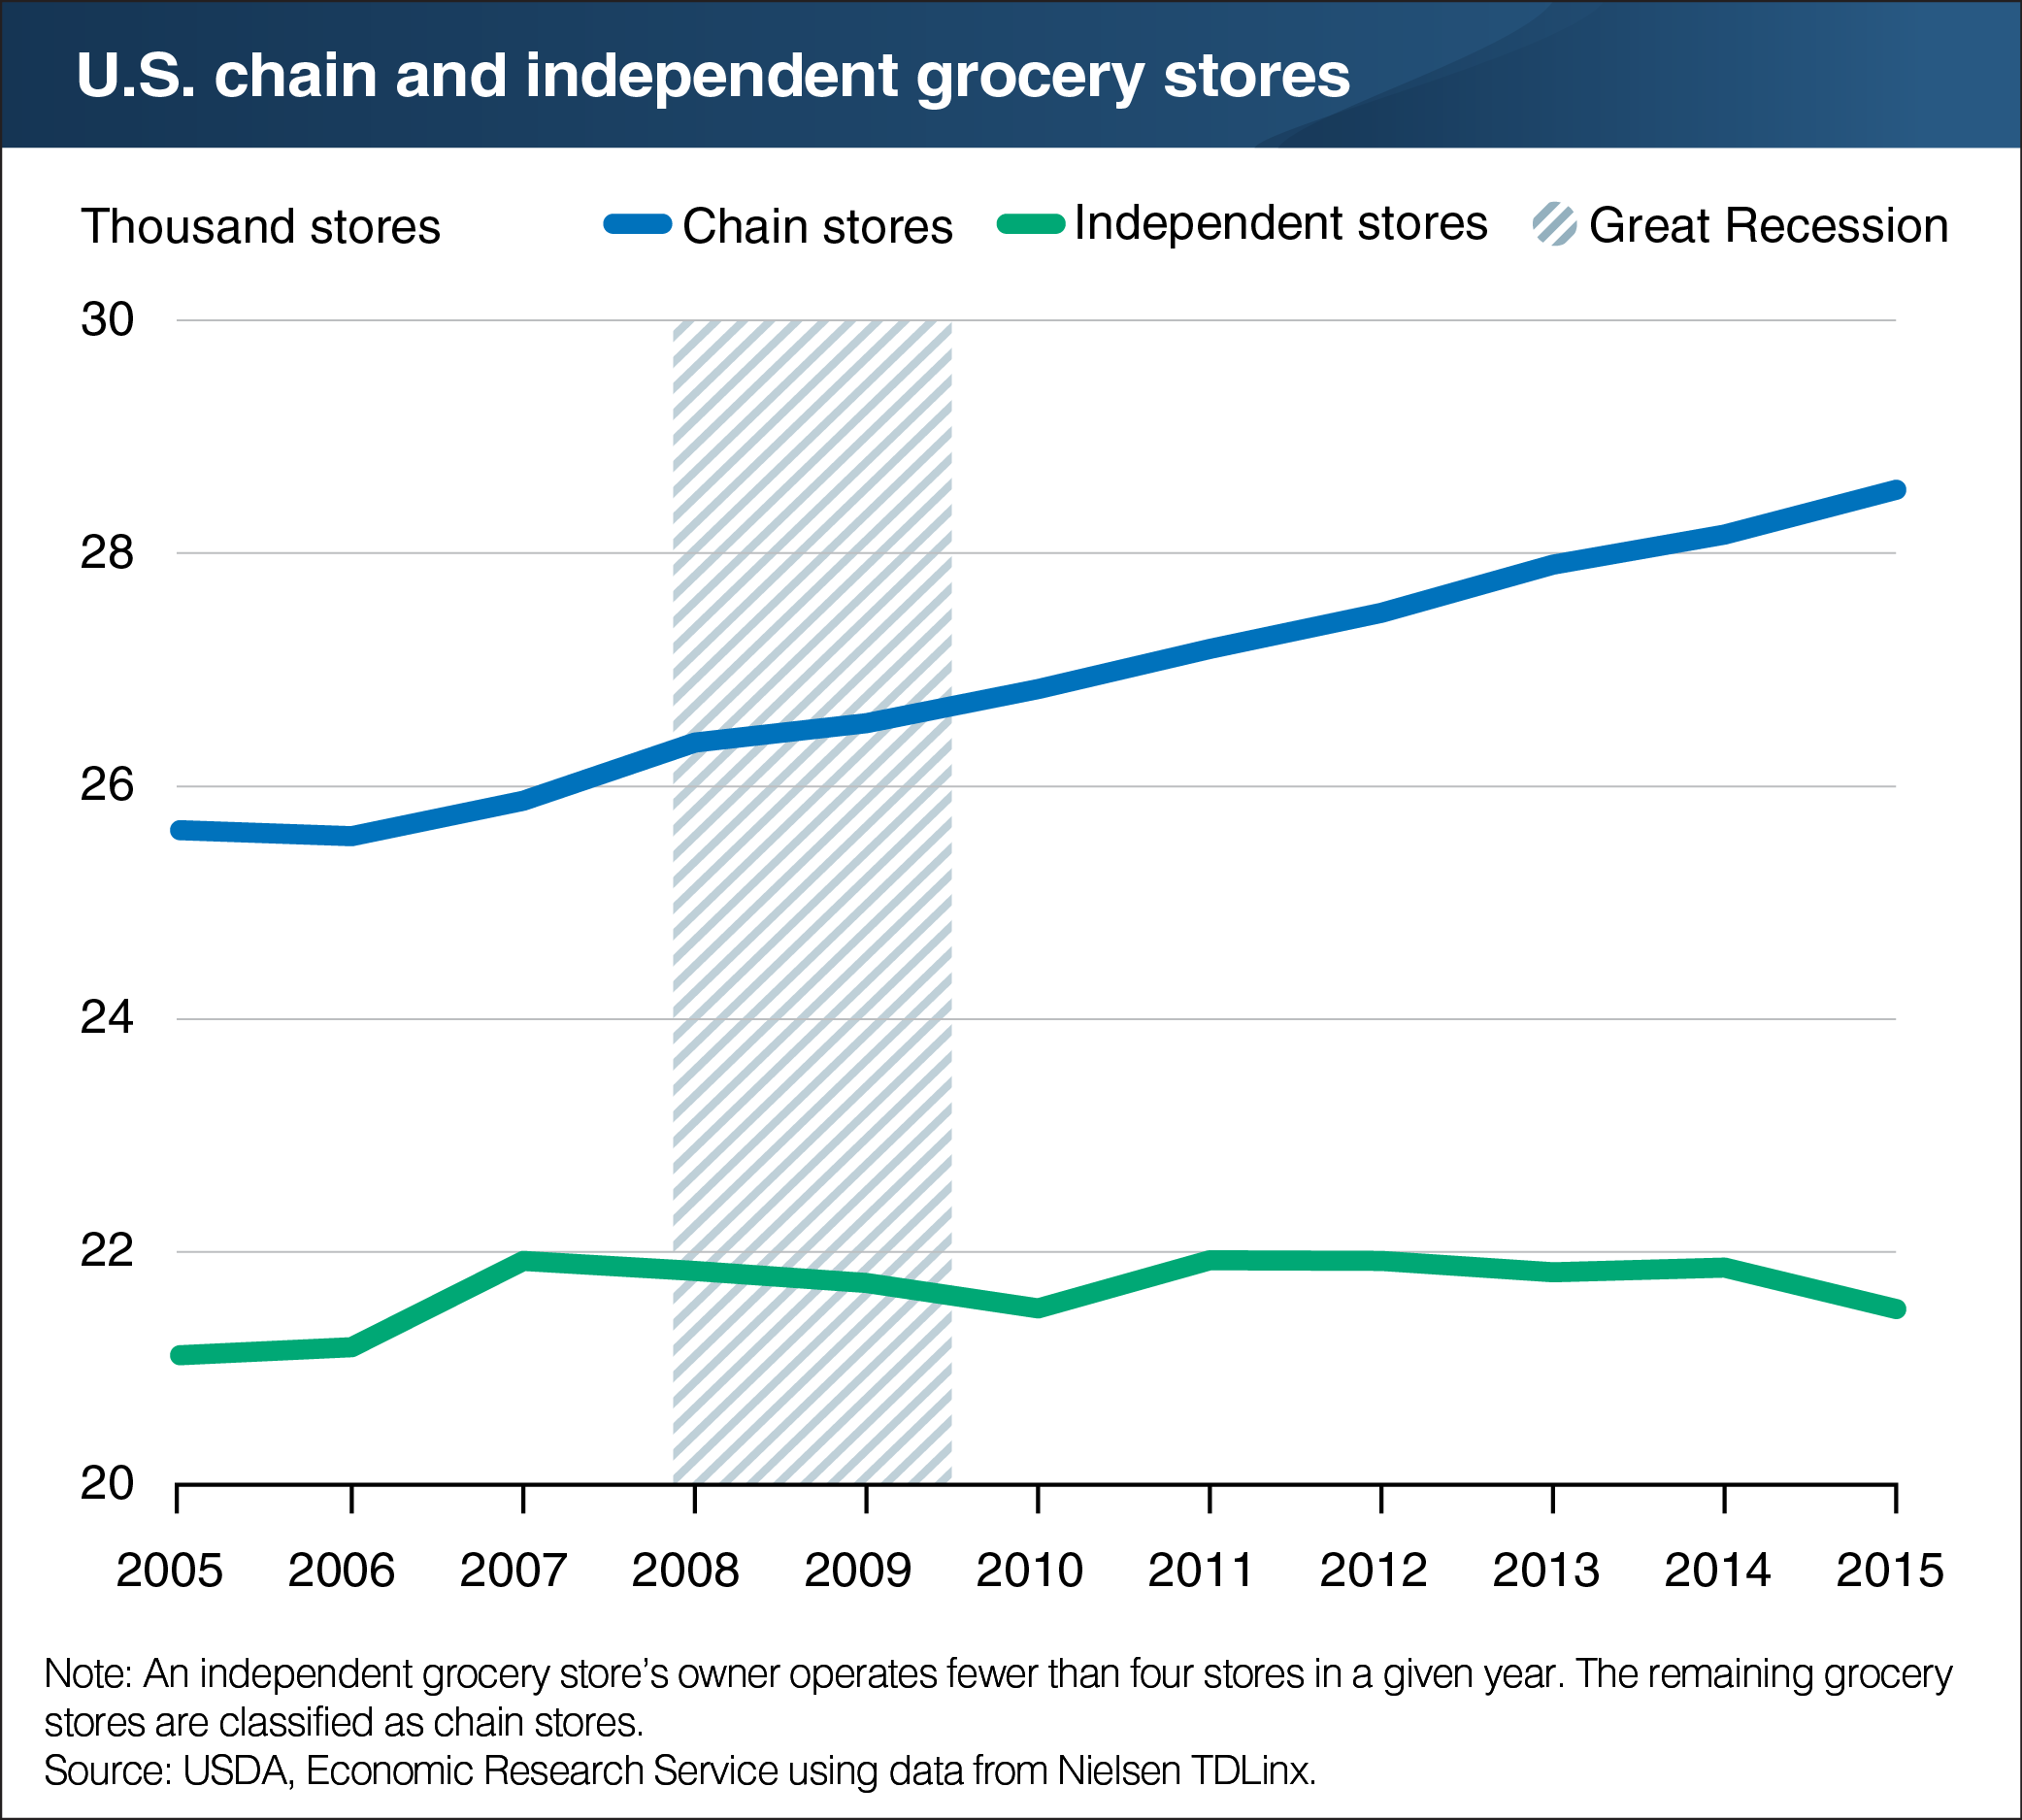
From 2005 to 2015, according to Nielsen’s TDLinx data, the number of grocery stores in the United States grew from 46,735 to 50,056—an increase of 7.1 percent. Grocery stores are defined as self-service stores with a full line of major food departments and at least $1 million in sales. At the onset of the Great Recession of 2007-09, the number of independent grocery stores—those whose owners operate fewer than four stores at one time—flattened out at around 21,800 stores. The remaining grocery stores, or chain stores, grew in number by about 2,700 stores to 28,546 in 2015. As a result, independent stores’ share of total stores declined from 46 percent in 2007 to 43 percent in 2015. Independent grocery stores are generally smaller than chain stores but are often the only grocery stores found in underserved areas. ERS analysis found that over the decade, both independent and chain stores increased in counties with population growth, although chain stores were more responsive. This chart is from the ERS report, Independent Grocery Stores in the Changing Landscape of the U.S. Food Retail Industry, released on November 22, 2017.