
Nonmetro population change varies across the United States
- by John Cromartie
- 6/29/2016
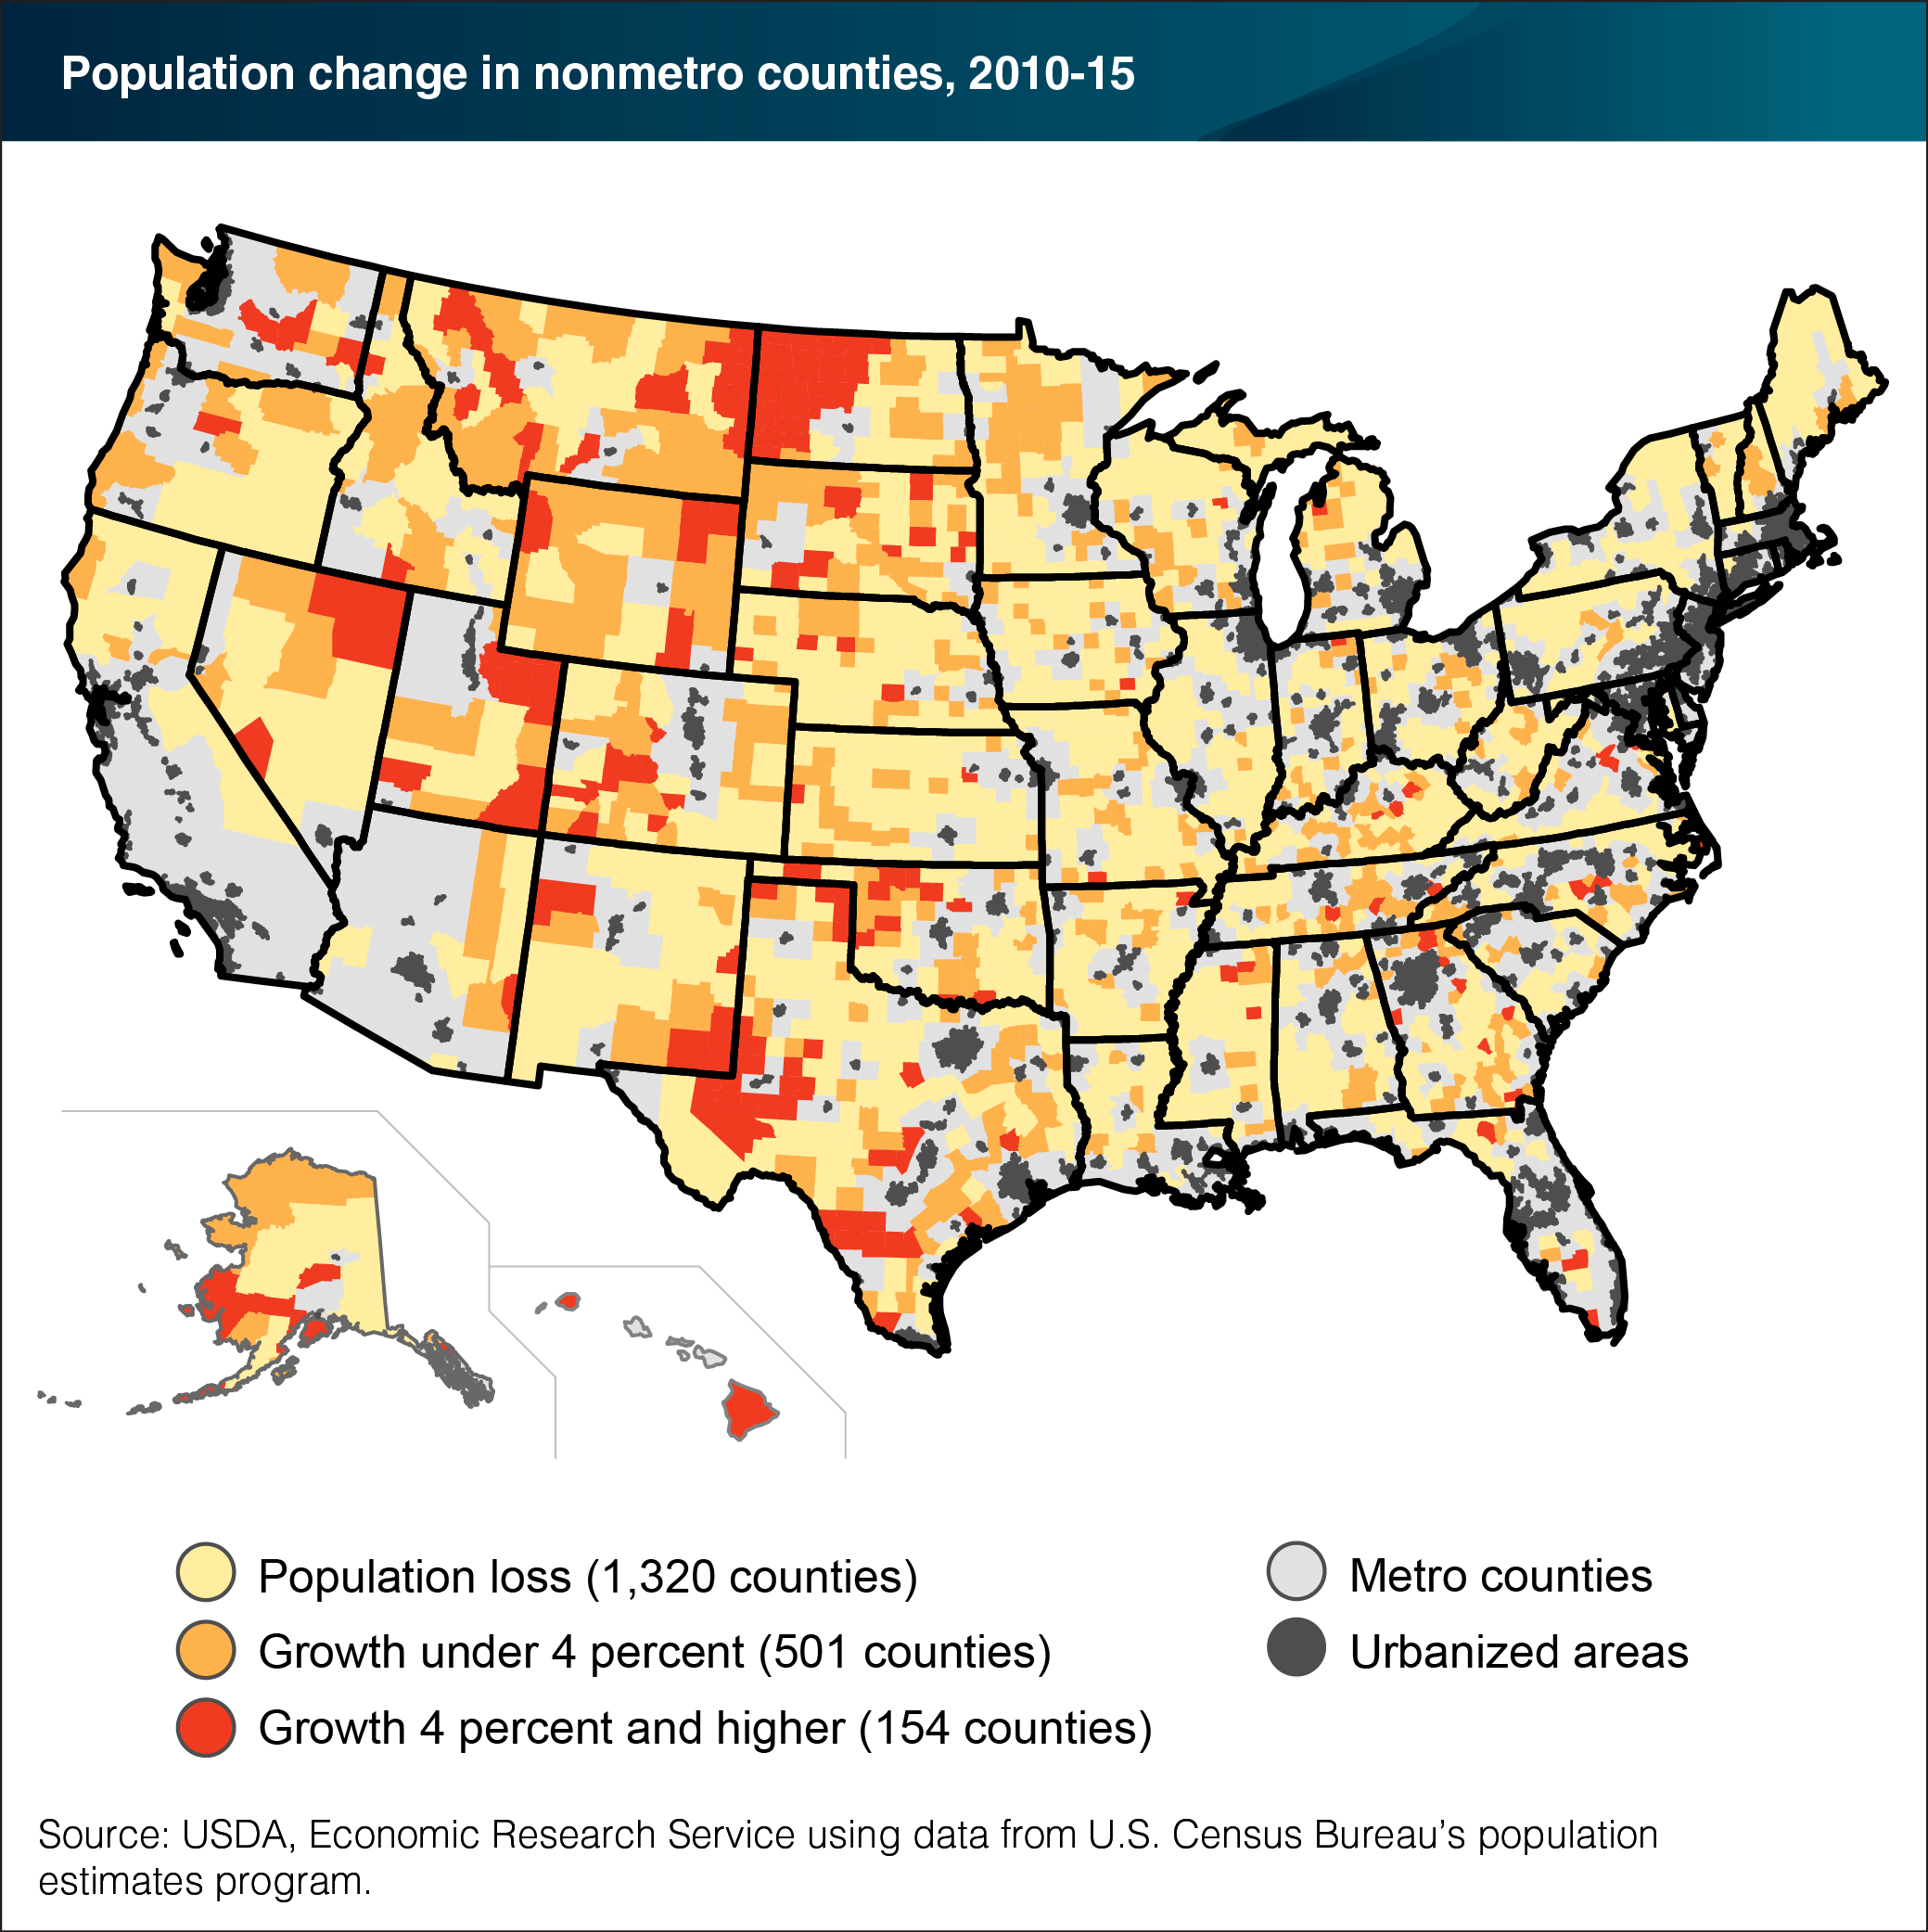
Population loss in nonmetro counties reached nearly 150,000 between July 2010 and July 2015, but this overall net loss of just -0.3 percent masks significant regional and local demographic diversity. First, the number of individual nonmetro counties losing population in a 5-year period reached a 50-year high of 1,320, with a net population loss of nearly 650,000. Since the Great Recession (which ended in mid-2009), new areas of population loss have emerged throughout the eastern United States, especially in manufacturing-dependent regions. Second, the 501 nonmetro counties with moderate population growth (less than 4 percent during 2010-15) together added just over 200,000 people. Many of these moderate-growth counties are located in rural parts of the Mountain West, southern Appalachia, and other scenic areas where population growth slowed considerably for the first time in decades. Third, most nonmetro population growth was concentrated in just 154 counties that grew by 4 percent or more, adding close to 300,000 people. Workers attracted to the oil and gas boom caused rapid growth in the northern Great Plains, western and southern Texas, and southeastern New Mexico. However, recent production cutbacks in these regions slowed population growth in mining-dependent counties in the past year (2014-15). At the same time, modest population recovery can be seen in nonmetro counties adjacent to metropolitan areas (in the path of renewed suburbanization) and in scenic counties with recreation-based economies. This map is based on the ERS topic page on rural Population and Migration and the June 2016 Amber Waves finding, "Five Years of Population Loss in Rural and Small-Town America May Be Ending.”