
After falling in the late 1990s and early 2000s, supermarkets' share of at-home food spending has stabilized
- by Annette Clauson and Howard Elitzak
- 4/27/2016
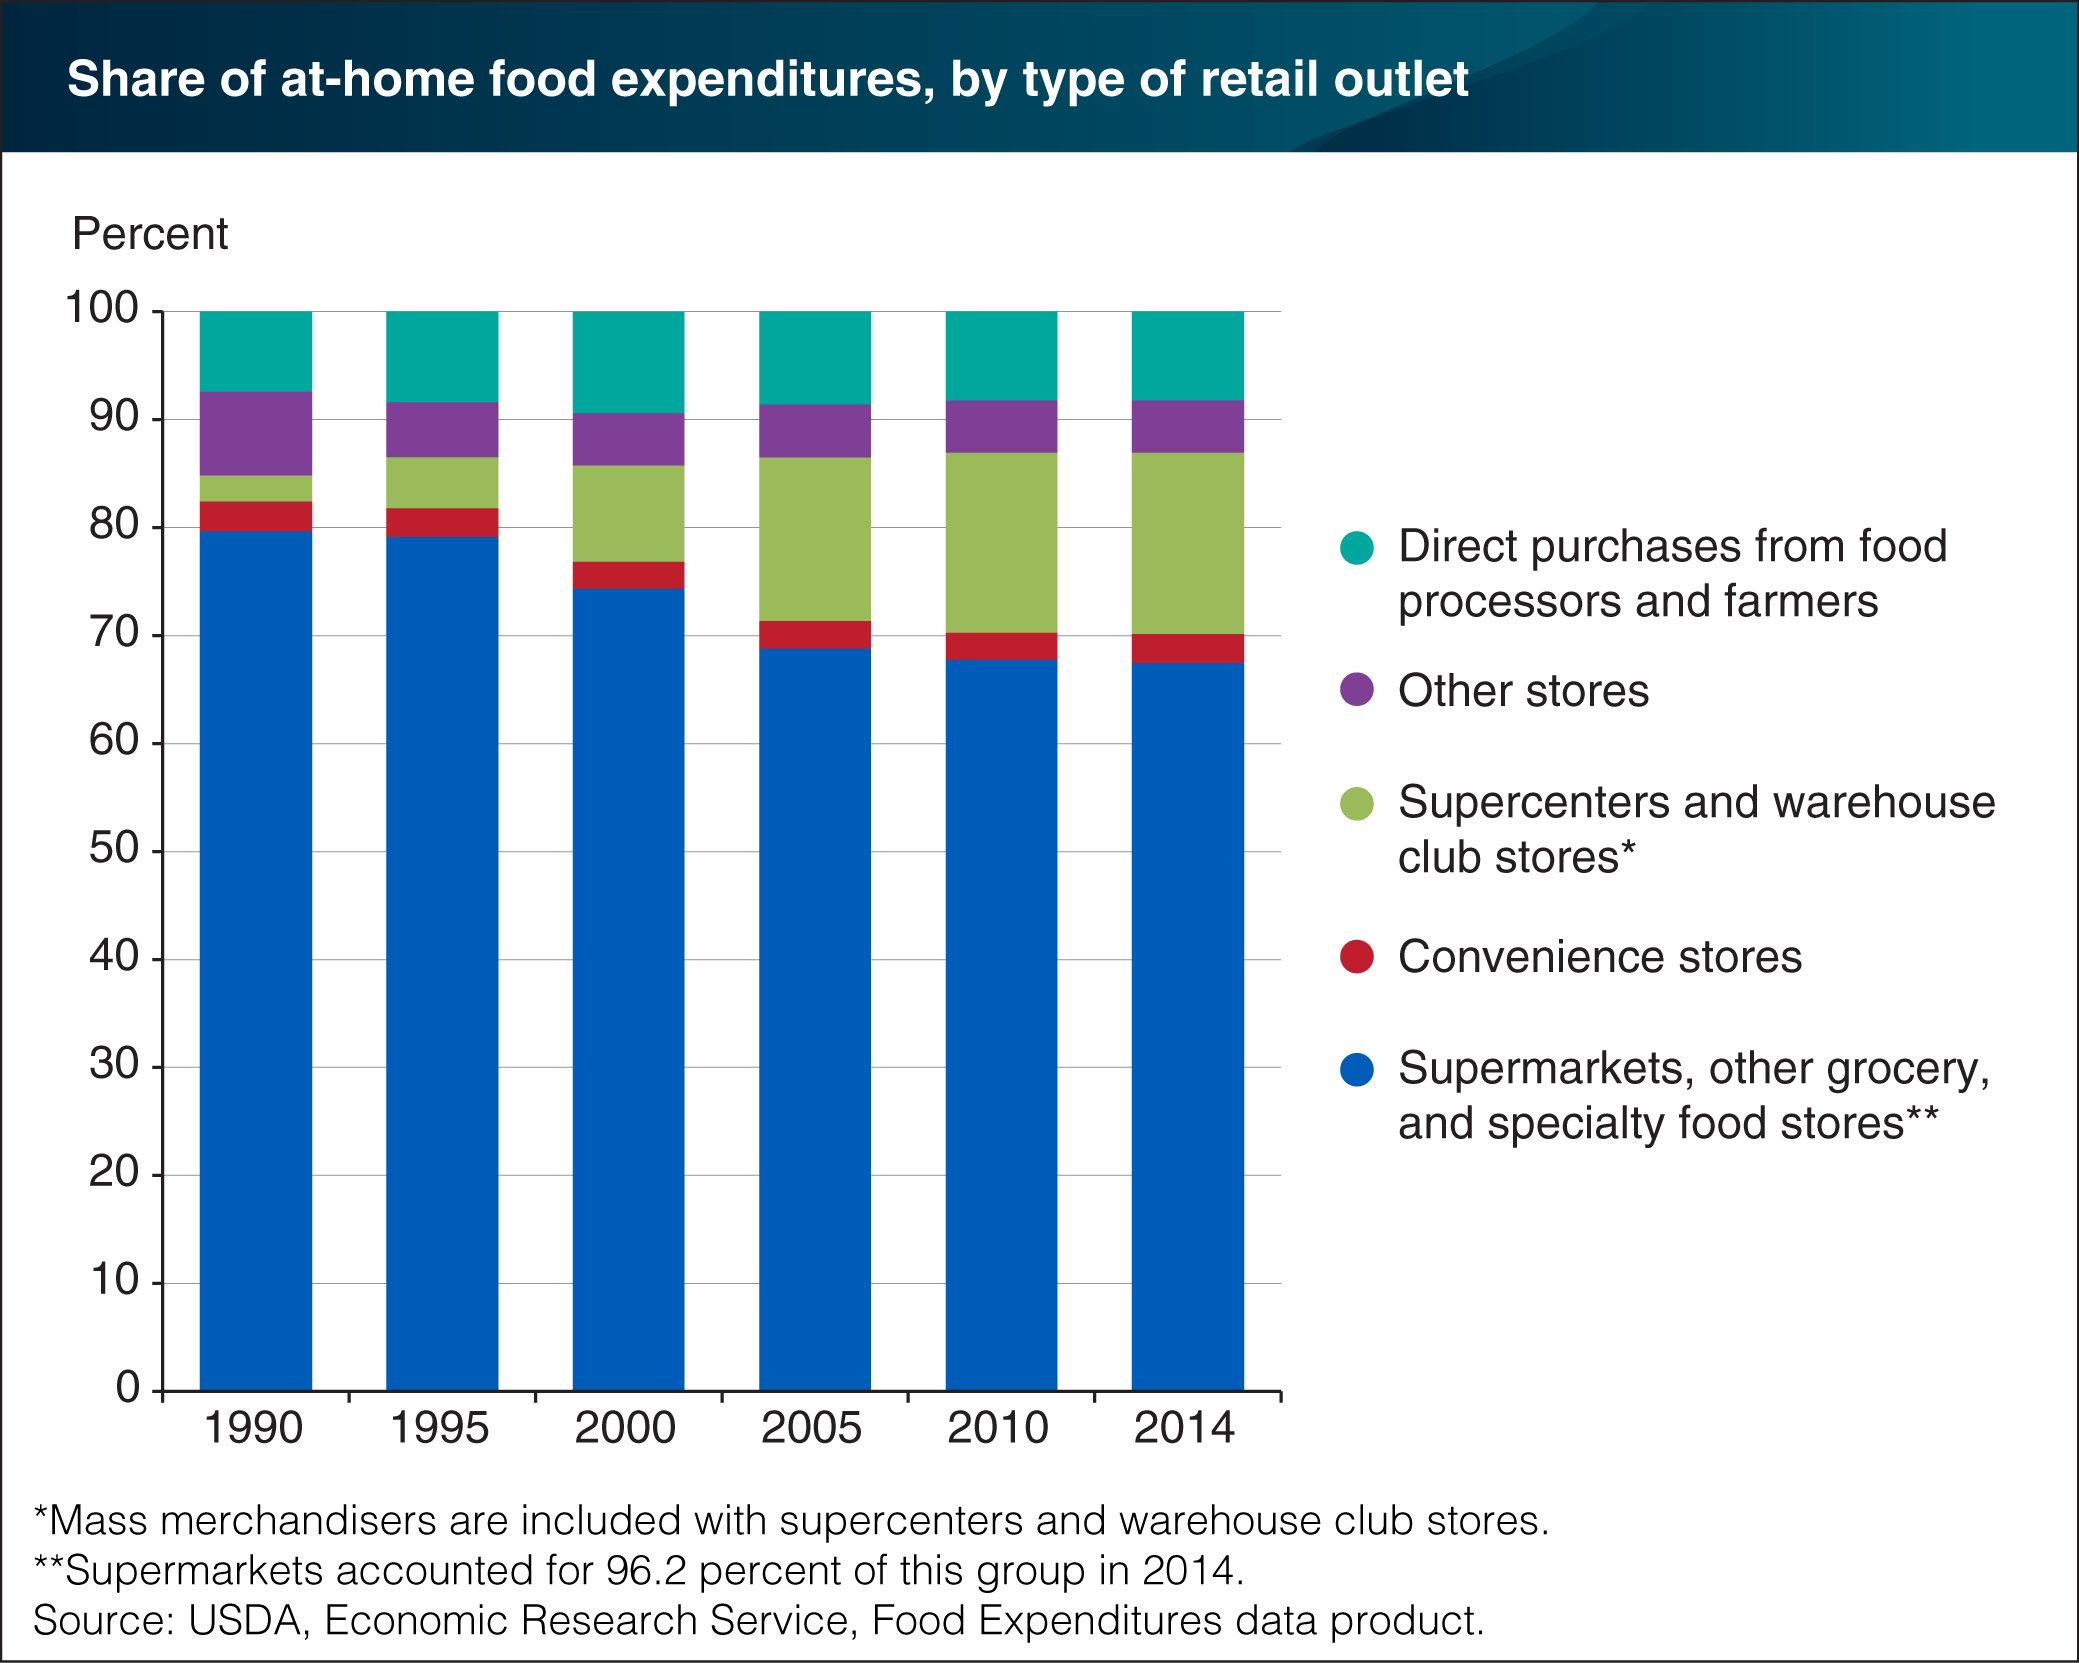
Americans spent $1.46 trillion on food in 2014. Of this total, 49.9 percent was spent in supermarkets, supercenters, farmers’ markets, convenience stores, and other retailers. The relative importance of the various outlets comprising the U.S. at-home-food market has shifted somewhat during the last 25 years. Supermarkets had a 64.9-percent share of at-home spending in 2014, down from a peak of 76.3 percent in 1993. In 1990, food expenditures in convenience stores were higher than those for warehouse club stores and supercenters. By 1993, the reverse was true; and by 2014, warehouse club stores and supercenters accounted for 16.8 percent of at-home spending. The combined share of direct purchases from food processors and farmers grew from 7.4 percent in 1990 to 9.4 percent in 2000, and their share has averaged 8.4 percent over the last decade. Other stores—for example, discount dollar stores and drug stores—accounted for 4.9 percent of the at-home-food market in 2014. This chart appears in “After a Sharp Rise Between 1990 and 2005, Supercenters’ Share of At-Home-Food Spending Has Leveled Off” in the April 2016 issue of ERS’s Amber Waves magazine.