
New county patterns of U.S. Hispanic population change emerge
- by John Cromartie
- 10/13/2015
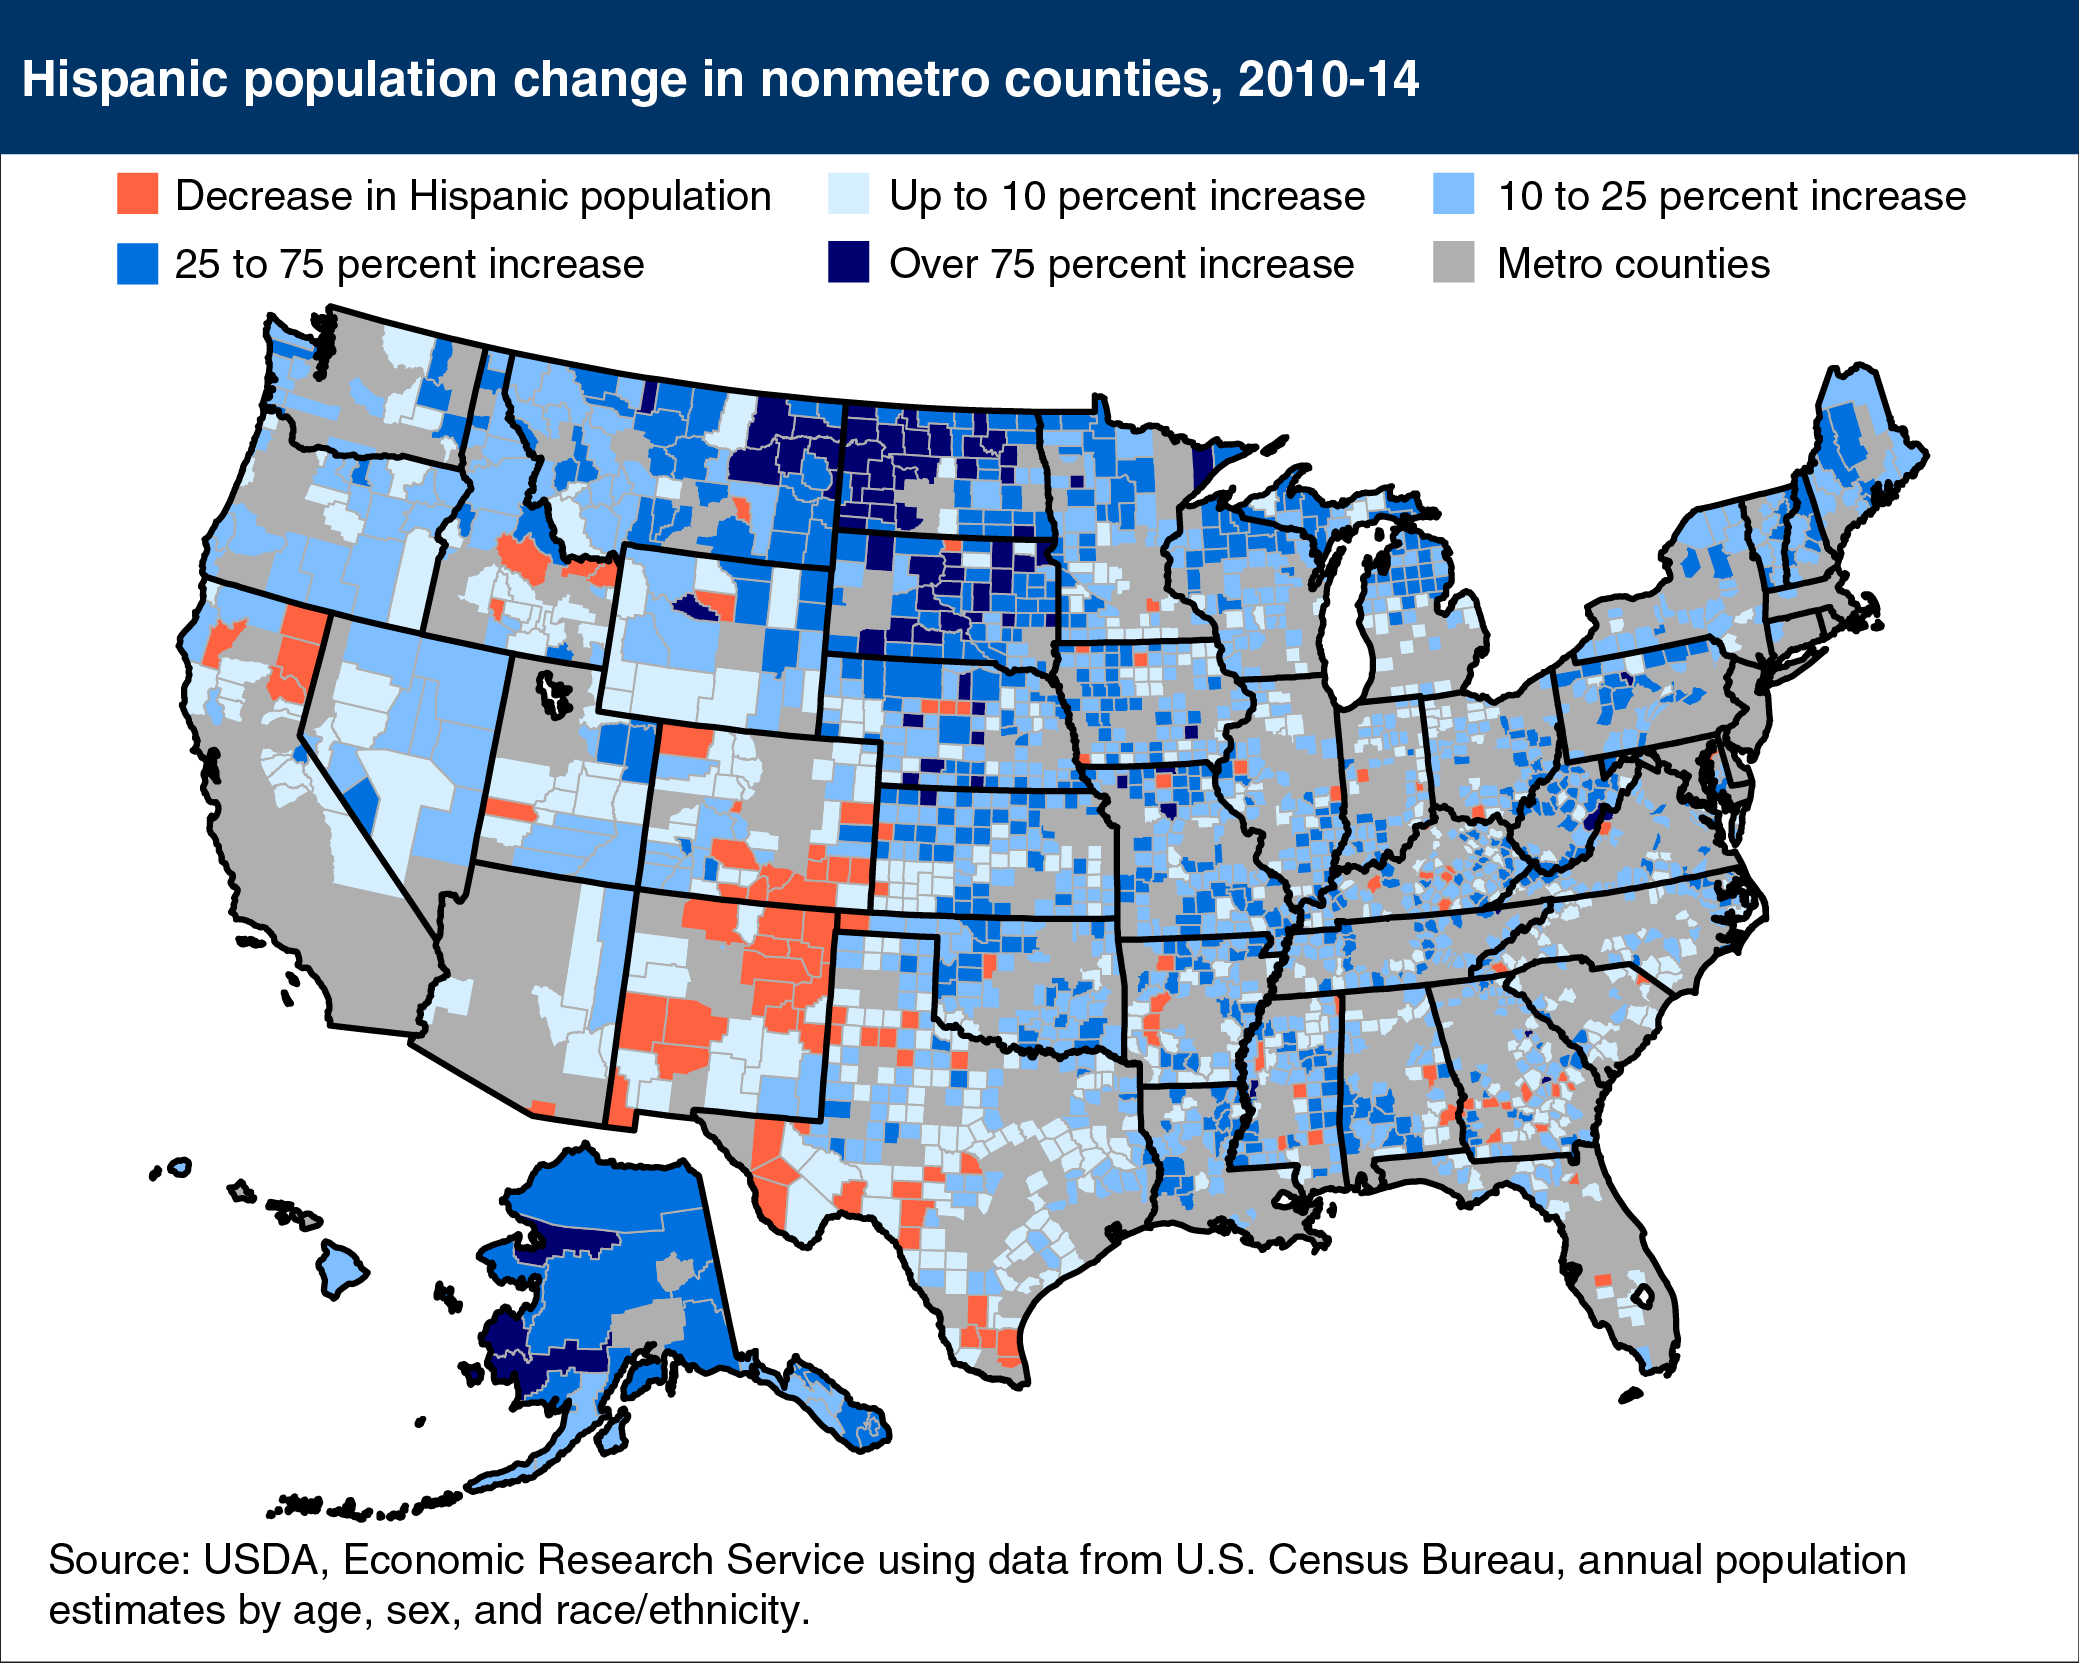
Hispanic population growth has slowed in both rural (nonmetro) and urban (metro) areas of the United States since the Great Recession, due to lower fertility rates and a decline in immigration, especially from Mexico. These demographic trends, along with shifts in the location of job opportunities, shifted geographic patterns of Hispanic population growth and decline across rural counties. According to the latest U.S. Census estimates, rural population growth remains above 2 percent per year for Hispanics, higher than for the non-Hispanic population (which is declining), but less than half the rate of growth seen during the 1990s and early 2000s. This downturn is most visible in farming and ranching counties in the American Southwest and in the Rio Grande Valley of Texas, areas that have for centuries had large Hispanic concentrations. Lower immigration contributed to this decrease, as did migration to new energy-sector jobs, most noticeable in the northern Great Plains in response to the shale oil and gas boom. Growth rates over 75 percent occurred in 79 rural counties, generally areas with few Hispanics in 2010 that added fewer than 10,000 new Hispanic residents as a whole. This map is based on the Atlas of Rural and Small Town America.