
Degree of rurality influences recent U.S. county population growth and decline
- by John Cromartie and Timothy Parker
- 4/16/2015
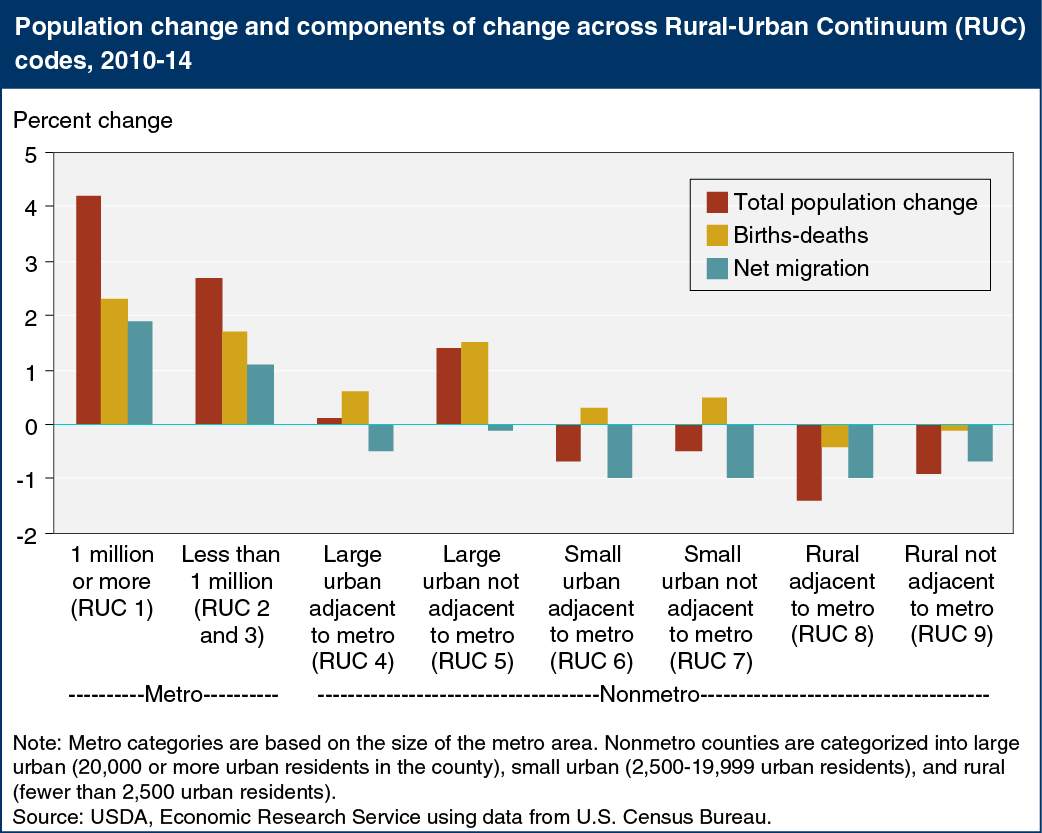
ERS Rural Urban Continuum (RUC) codes subdivide the broad metro/nonmetro categories into three metro and six nonmetro groupings. Recently released county-level estimates show that population change within the RUC ranged from over 4-percent growth in metro areas with 1 million or more people to 1-percent declines in the two rural, nonmetro categories. Overall population growth occurred in nonmetro counties with sizeable towns (more than 20,000 urban residents) despite net out-migration. In these counties, employment opportunities often attract younger populations, which in turn imparts higher rates of natural increase (more births than deaths) compared with other nonmetro counties. Conversely, long-term out-migration of younger people results in an older average population in the most rural counties, creating a pattern of natural decrease (more deaths than births). For decades, nonmetro counties that were physically adjacent to metro areas grew rapidly from suburbanization. This is no longer happening, due to the effects of the housing crisis, changing residential preferences that favor urban centers, and reclassification of fast-growing suburban counties from nonmetro to metro. This chart is found in the ERS topic page on Population and Migration, updated April 2015.