
U.S. hog production increasingly occurs on the largest operations
- by Nigel Key and William D. McBride
- 1/12/2015
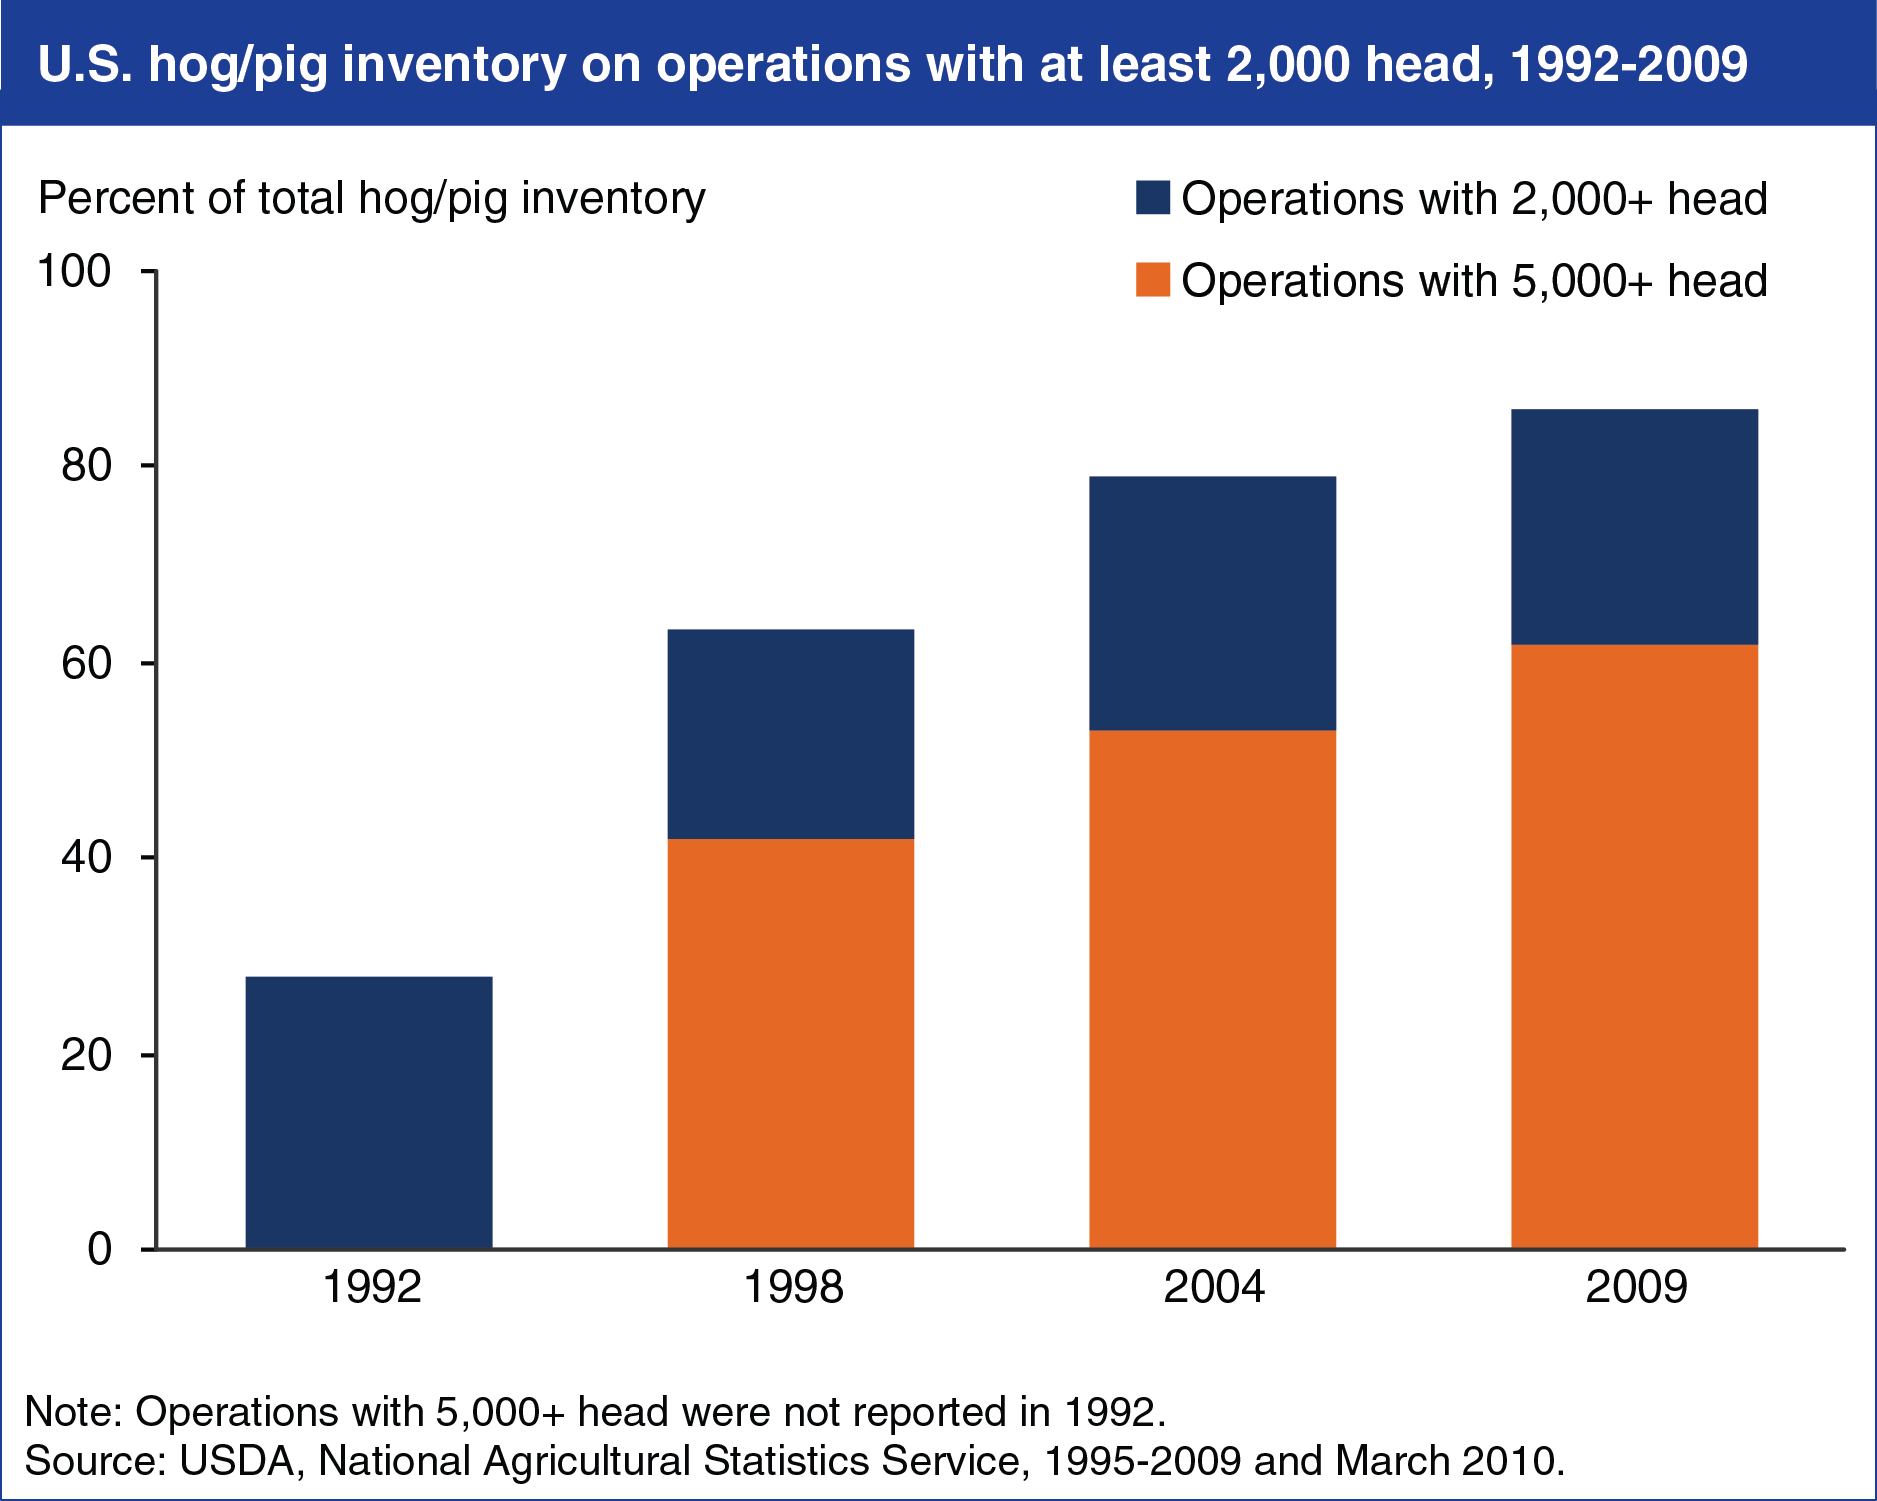
While the number of all farms in the United States remained fairly constant, the number of hog farms fell by about 70 percent between 1992 and 2009, from over 240,000 to about 71,000. Despite fewer hog farms, the Nation’s hog inventory was stable during the period, averaging about 60 million head, with cyclical fluctuations between 56 and 68 million head. Thus, hog production consolidated as fewer, larger farms accounted for an increased share of total output. From 1992 to 2009, the share of the U.S. hog and pig inventory on farms with 2,000 head or more increased from less than 30 percent to 86 percent. In 2009, farms with 5,000 head or more accounted for 61 percent of all hogs and pigs. This chart is found in the ERS report, U.S. Hog Production From 1992 to 2009: Technology, Restructuring, and Productivity Growth, ERR-158, October 2013.