
Composition of top U.S. food retailers changed between 2008 and 2012
- by Howard Elitzak
- 3/18/2014
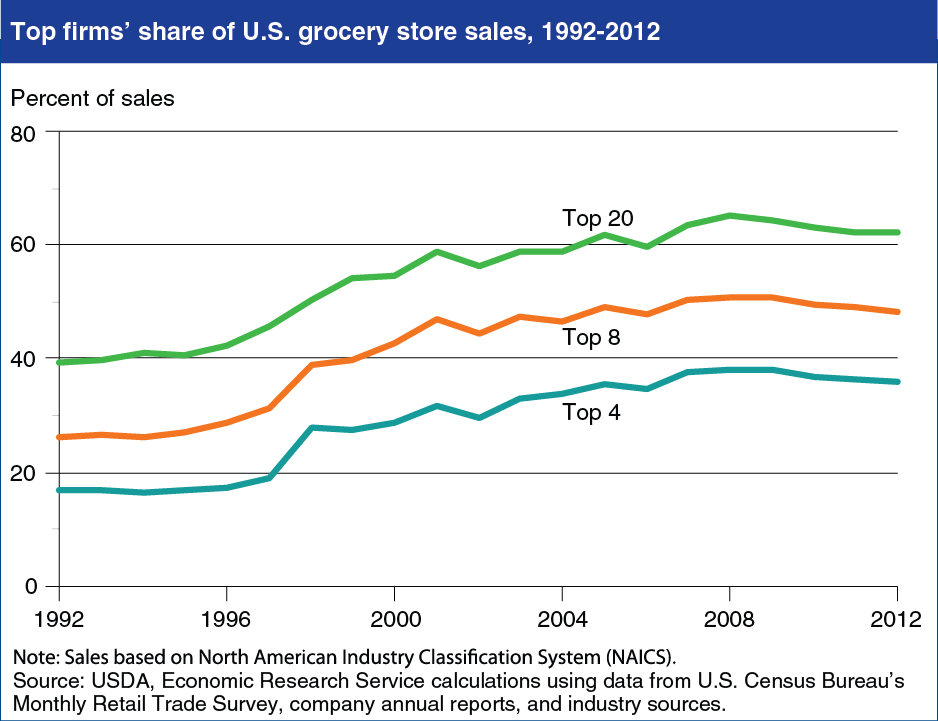
Grocery sales shares of the largest 4, 8, and 20 U.S. supermarket and supercenter retailers have decreased slightly since 2008, and company rankings have shifted somewhat. The 4 largest U.S. grocery retailers—Wal-Mart Stores, Kroger, Safeway, and Publix Super Markets—accounted for 36.1 percent of the $686 billion in total U.S. food and non-food (excluding fuel) grocery sales in 2012, down from 38.1 percent in 2008. Wal-Mart Supercenters maintained their dominant market share, with sales that were 53 percent higher than second-place Kroger in 2012. Ahold USA rose from sixth to fifth place despite 2012 sales that grew more slowly than in 2011. Target was among the largest 20 grocery retailers in 2012, taking the 14th spot. Target’s grocery sales rose at a faster pace in 2012 than the previous year, in contrast to the top 4 firms. SuperValu dropped from fourth to sixth place between 2011 and 2012, reflecting the late-in-the-year sale of about 90 percent of its approximately 1,900 retail outlets. Bi-Lo Holdings became the Nation’s 11th-largest grocery retailer, following the acquisition of 483 Winn-Dixie supermarkets in 2012. This chart appears in the Retailing and Wholesaling topic page on the ERS website, updated February 5, 2014.