
Participation in SNAP varies across States, reflecting differences in need and program policies
- by Laura Tiehen
- 2/13/2014
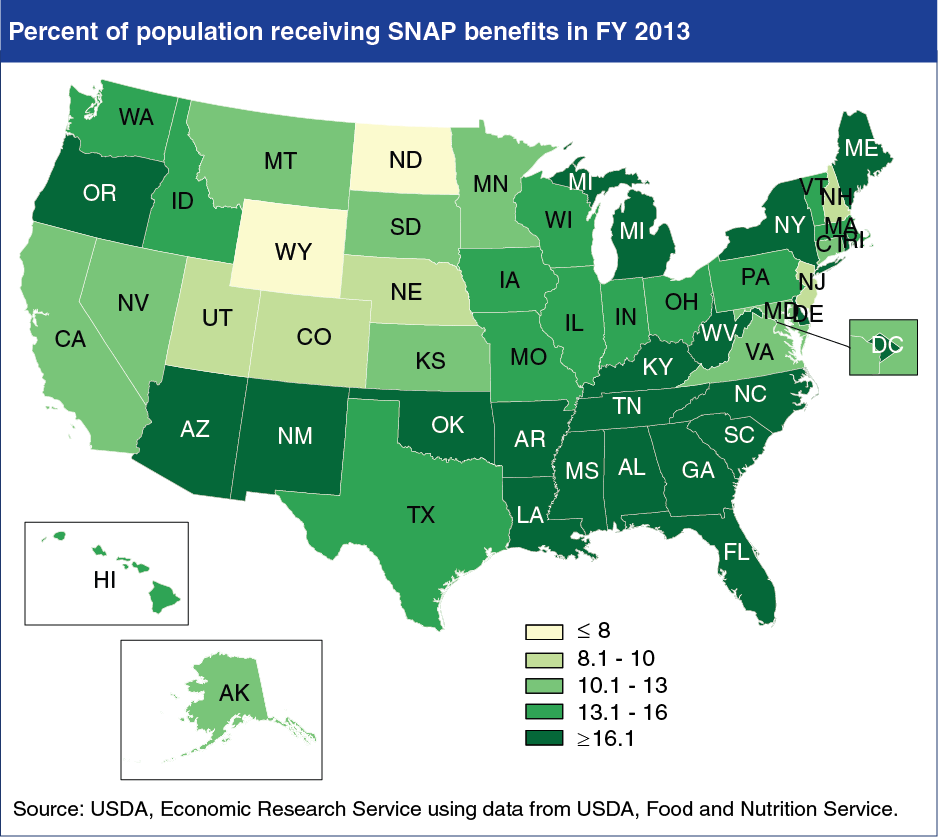
The Supplemental Nutrition Assistance Program (SNAP) is the cornerstone of USDA's nutrition assistance programs. The program served an average of 47.6 million people per month in fiscal 2013, or about 15 percent of Americans. The percent of the population receiving SNAP benefits to purchase food varies across States, reflecting differences in need and in program policies. The percent of the State population receiving SNAP ranged from a low of 6.5 in Wyoming to a high of 22.4 in Mississippi and the District of Columbia. The Southeast stands out as a region where all States have a high percent of residents receiving SNAP benefits, with participation rates of 17.3 to 22.4 percent. Between 2012 and 2013, 16 States saw a decrease in the percent of residents receiving SNAP benefits, while 34 States and the District of Columbia saw an increase. Most increases were small, with only 6 States showing more than a 5-percent increase in their State SNAP participation rate. This chart appears in the ERS data product, Ag and Food Statistics: Charting the Essentials, updated February 11, 2014.