
Rural high-poverty counties are concentrated in the South and Southwest
- by Economic Research Service
- 12/11/2013
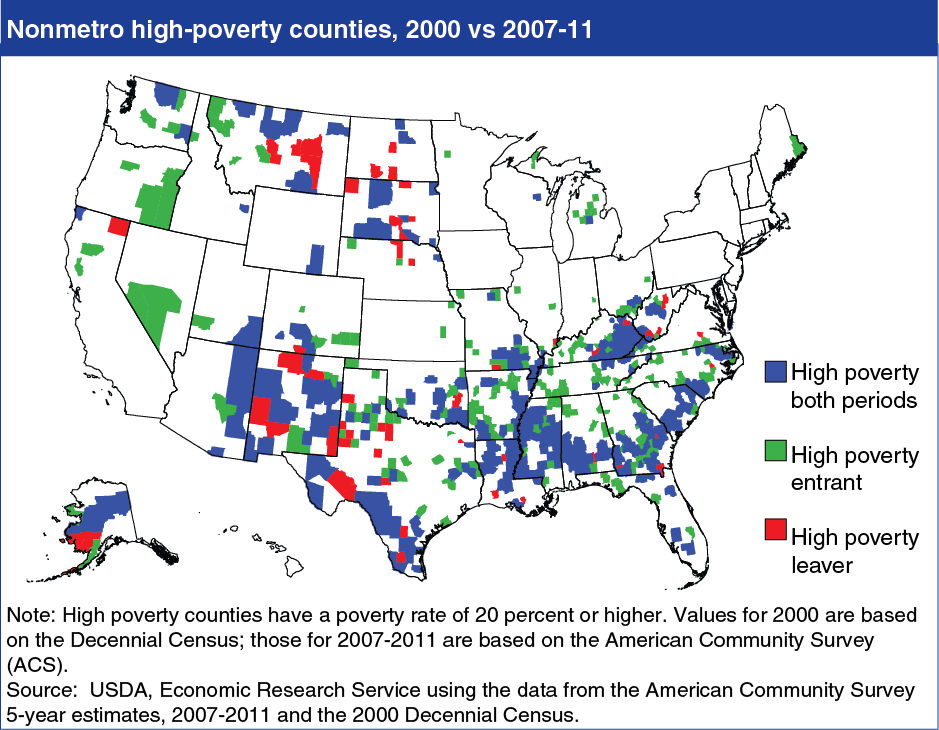
The national poverty rate (based on pre-tax income of less than $23,492 for an average family of four) was 15.0 percent in 2012; the rate was 17.7 percent in nonmetro areas and 14.5 percent in metro areas. High-poverty counties—those with a poverty rate of 20 percent or higher—are often geographically clustered. During 2007-11, there were 703 high-poverty counties in the United States; 571 were nonmetro, mostly in the South and Southwest. Most newly-classified rural high-poverty counties are located adjacent to clusters of historically high-poverty counties, but some were outside these clusters, mainly in areas with substantial losses in the real estate market and manufacturing employment between 2006 and 2009. This map is found in Rural America at a Glance, 2013 edition, released November 2013.