
Rising sales shares of largest U.S. food retailers dampened by 2007-09 recession
- by Economic Research Service
- 4/19/2013
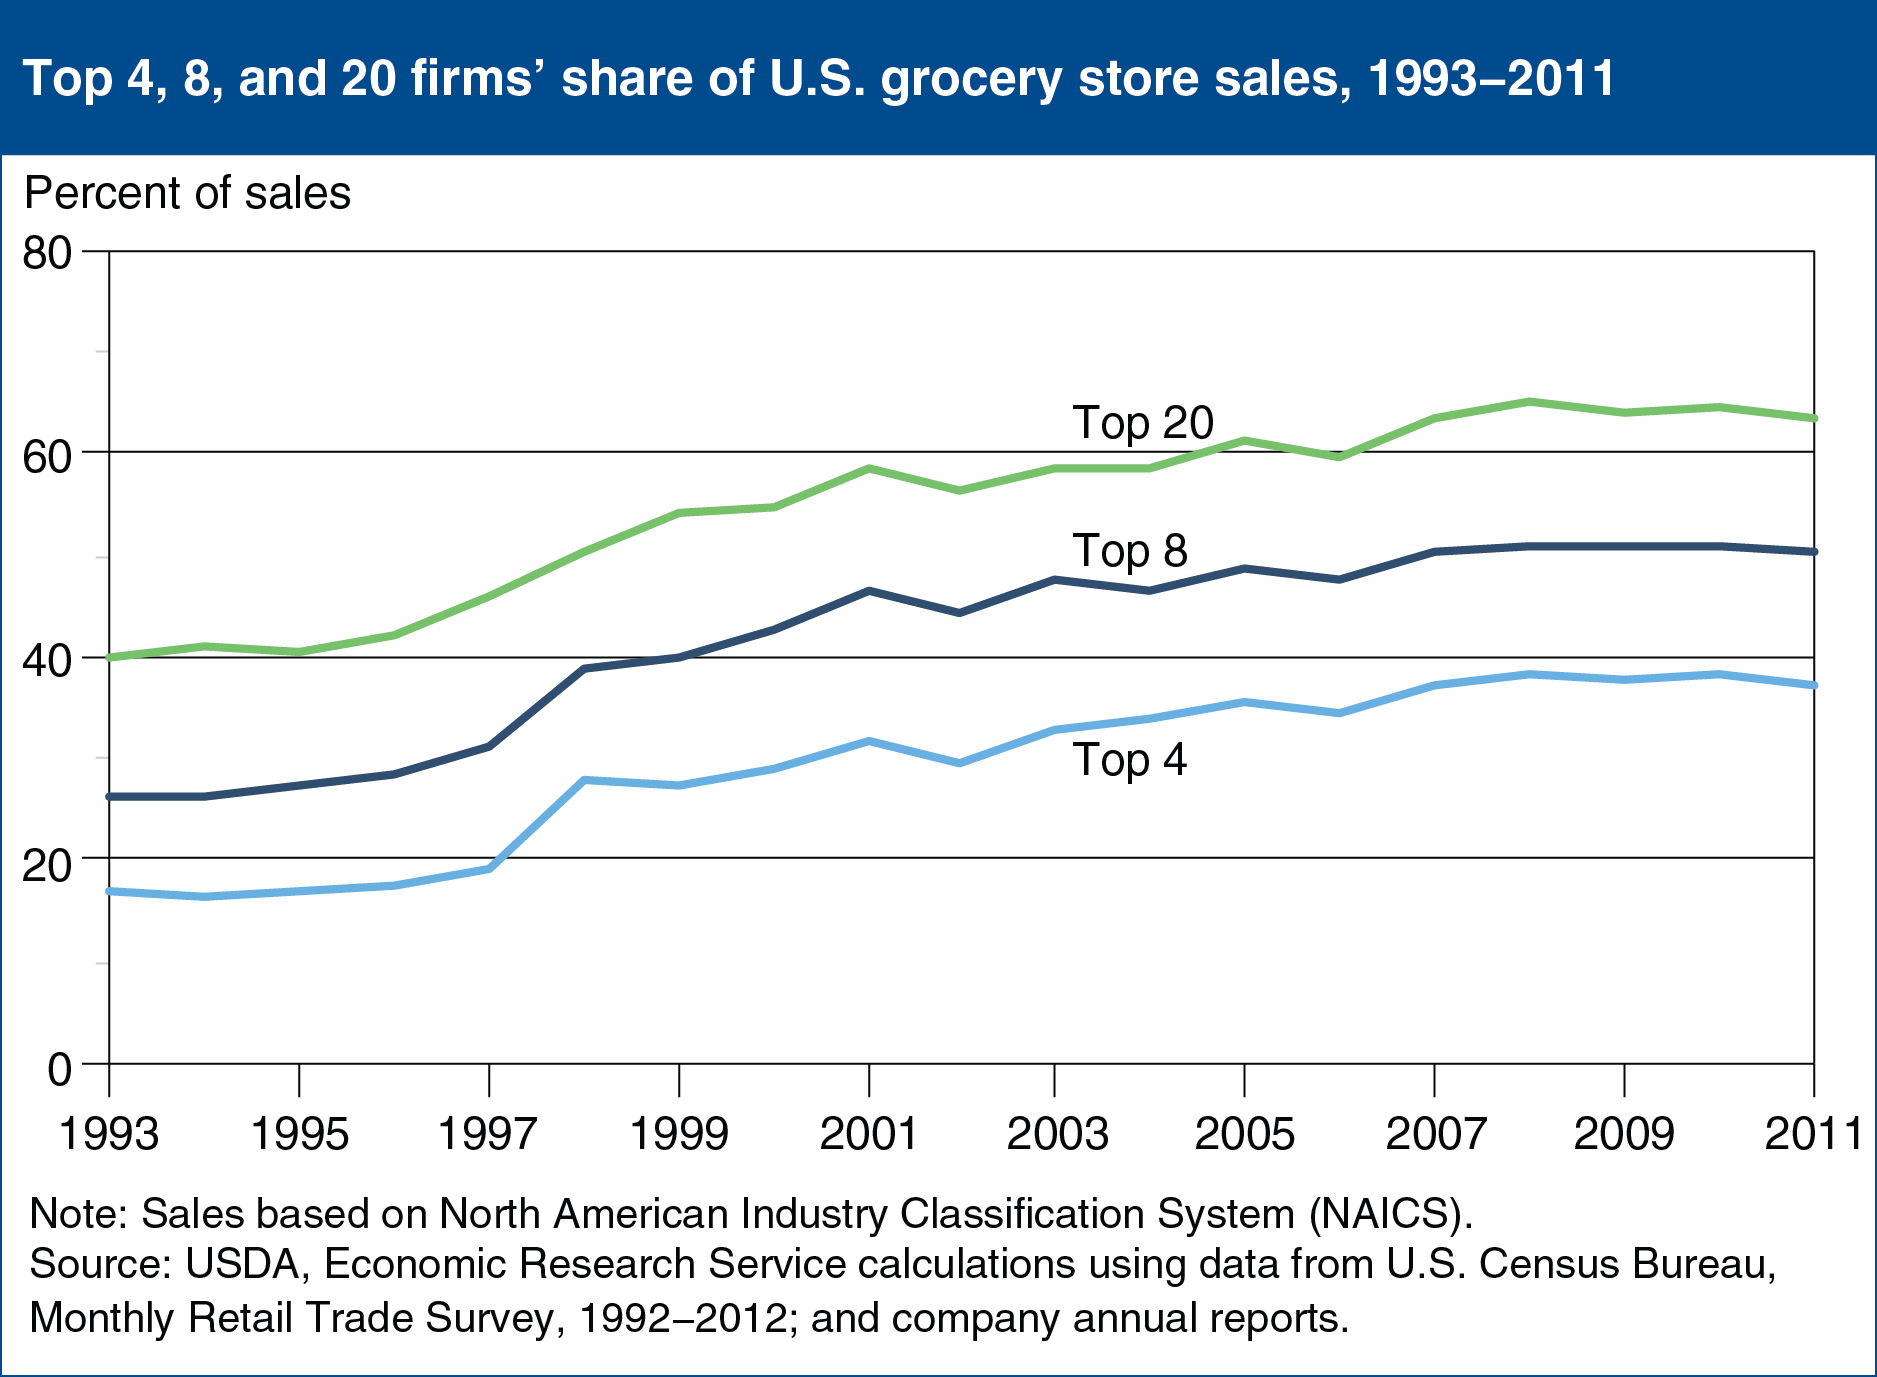
Sales by the 20 largest food retailers operating in the United States totaled $418 billion in 2011, accounting for 63.7 percent of total U.S. grocery store sales. The top 4 and 8 food retailers accounted for 37.3 percent and 50.5 percent, respectively, of total U.S. grocery store sales in 2011. With the Great Recession (December 2007 to June 2009), these sales shares began to flatten in 2008, contrasting with the longer term trend of increasing concentration of sales among the Nation’s largest grocery retailers. Mergers and acquisitions contributed to increasing concentration during the mid-to-late 1990s, with divestitures and internal growth playing a larger role since 2007. One contributing factor to the increases over the 1993-2008 period has been the rapid growth of Wal-Mart Supercenters. Their food and nonfood grocery sales amounted to an estimated $109 billion in 2011, making it the largest U.S. retailer of grocery products. In comparison, second-place Kroger had sales of $71 billion in 2011. This chart appears in the Retailing & Wholesaling topic page on the ERS website, updated March 27, 2013.