
Share of income from government transfer payments varies by region
- by Economic Research Service
- 11/16/2012
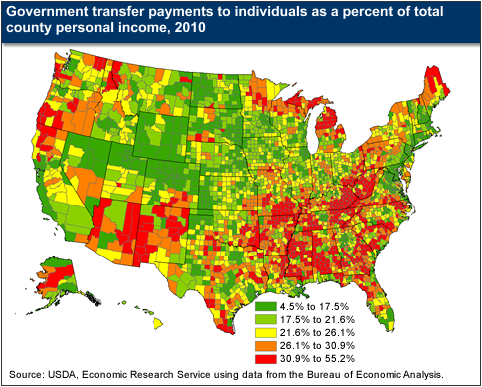
Government transfer payments (such as medical benefits, retirement and disability insurance, and nutrition assistance programs) comprise a large share of personal income for both nonmetro and metro residents. Transfer payments to individuals accounted for 25.6 percent of total nonmetro personal income and 16.8 percent of metro personal income, in 2010. Of the $2.2 trillion in Federal, State, and local government personal transfer payments to individuals in 2010, $415 billion went to nonmetro residents and $1.8 trillion went to metro residents. The counties with the highest percentage of total income from government transfer payments in 2010 were concentrated in Appalachia and the Mississippi Delta. The top three nonmetro counties with the highest percentage of total income from government transfer payments were located in eastern coal fields of Kentucky. These counties have high levels of disability payments along with very high unemployment and poverty rates. This chart is from the Rural Poverty & Well-Being topic page on the ERS website.