
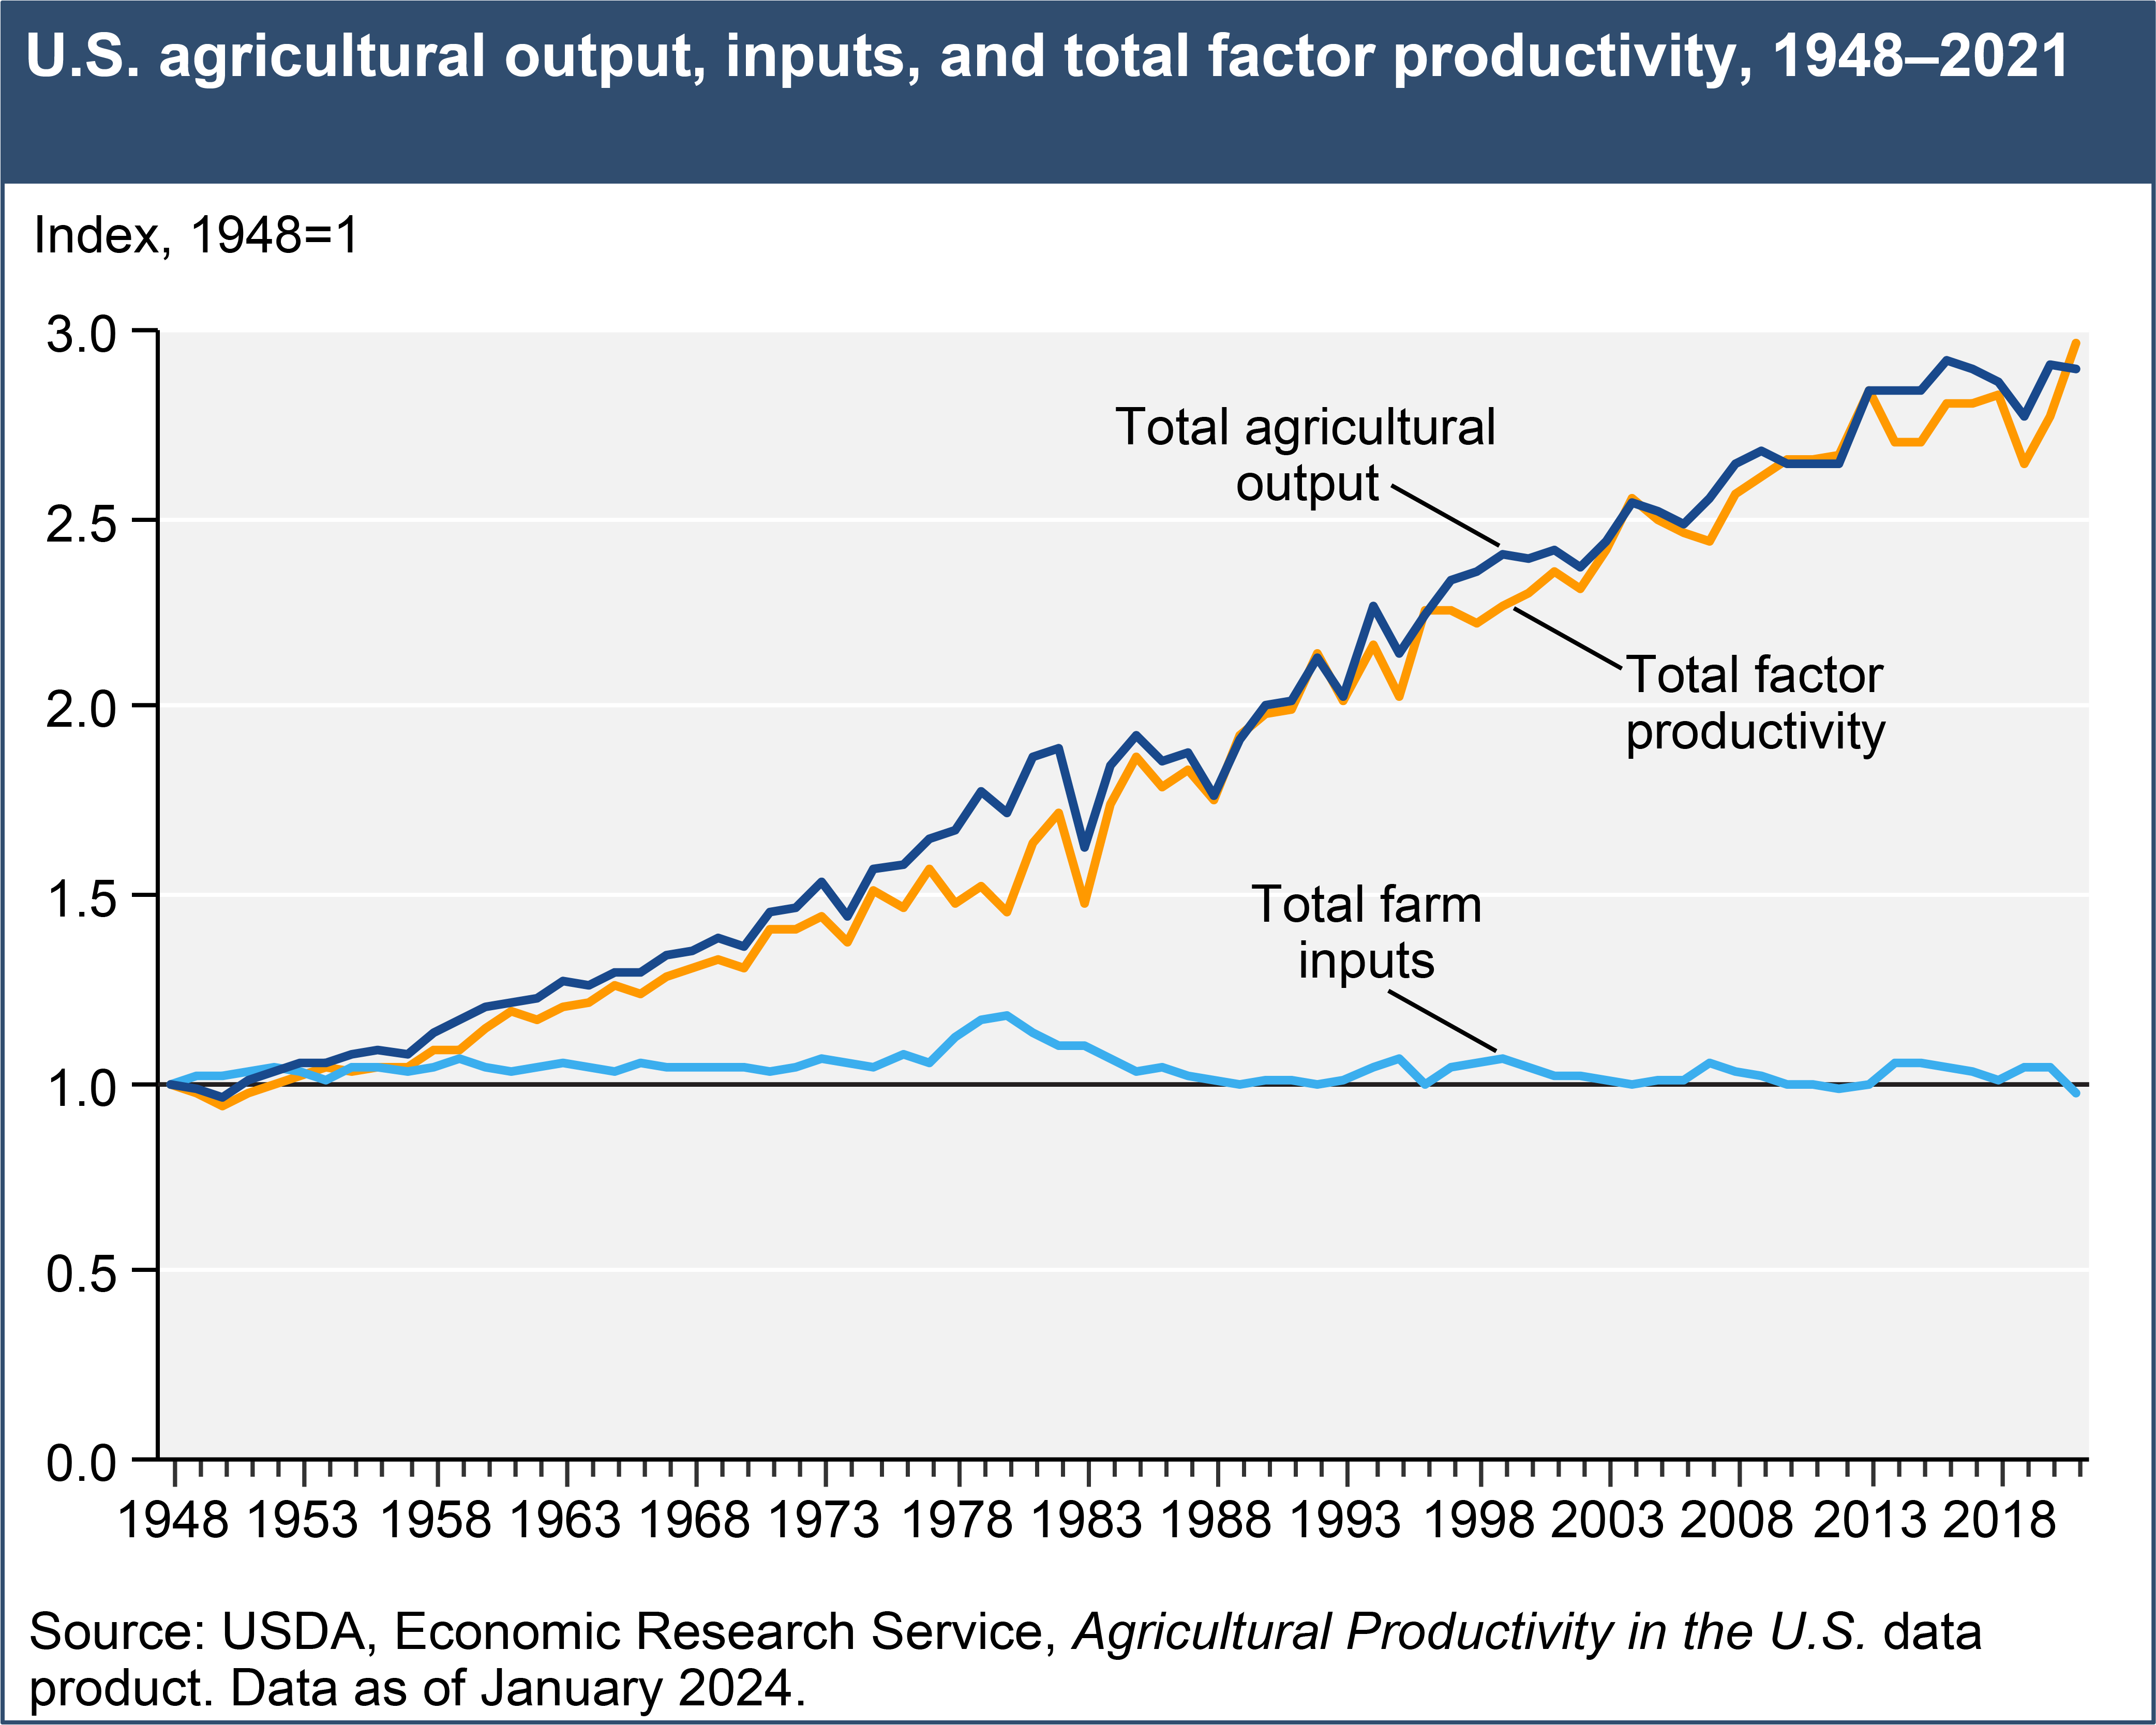
U.S. agricultural output, inputs, and total factor productivity, 1948–2021
- by Sun Ling Wang
- 1/12/2024
Download chart image | Chart data
U.S. agricultural output, inputs, and total factor productivity, 1948–2021
Official websites use .gov
A .gov website belongs to an official government organization in the United States.
Secure .gov websites use HTTPS
A lock (
) or https:// means you’ve safely connected to the .gov website. Share sensitive information only on official, secure websites.
Download chart image | Chart data
U.S. agricultural output, inputs, and total factor productivity, 1948–2021