
Food insecurity in U.S. households varies across race and ethnicity
- by Laura J. Hales
- 4/8/2024
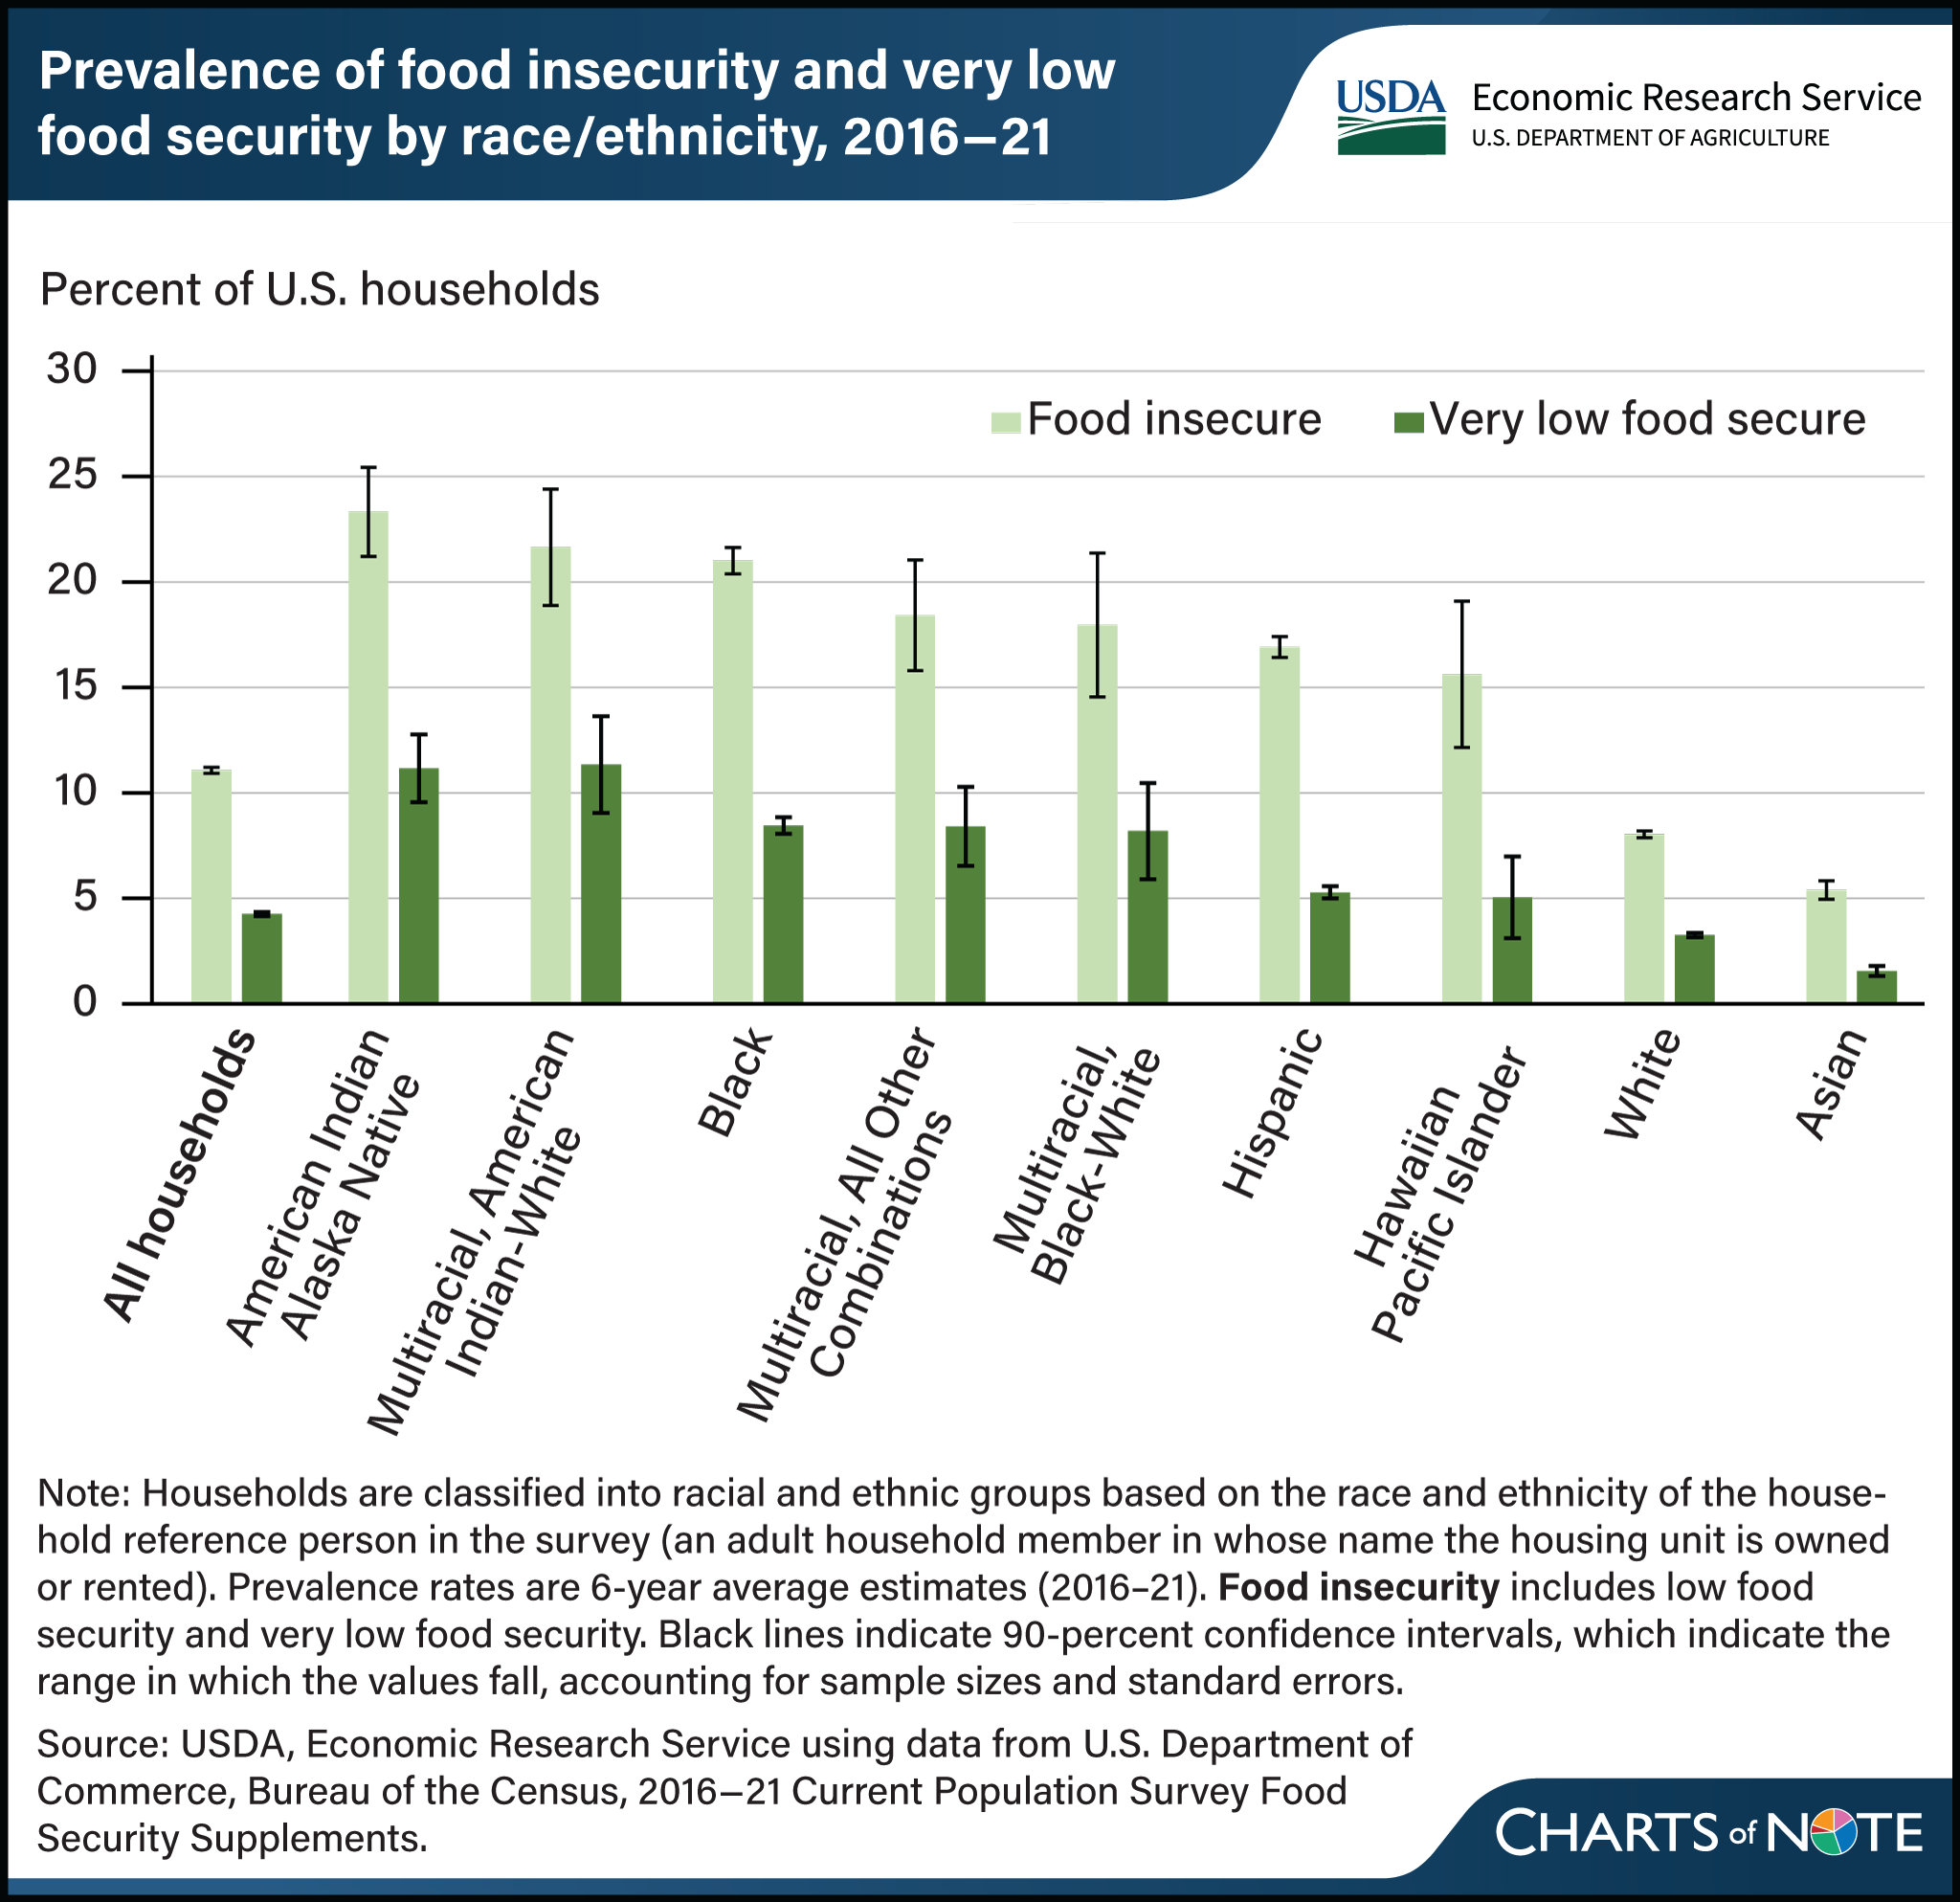
From 2016 to 2021, 11.1 percent of U.S. households experienced food insecurity, meaning they had difficulty providing enough food for all their members because of a lack of resources. Over the same period, 4.3 percent of U.S. households experienced very low food security, a more severe form of food insecurity in which food intake is reduced and eating patterns are disrupted. The prevalence of food insecurity during 2016–21 varied by race and ethnicity. Households headed by a reference person who identified as American Indian and Alaska Native (23.3 percent); Multiracial, American Indian-White (21.7 percent); Black (21.0 percent); Multiracial, All Other Combinations (18.4 percent); Multiracial, Black-White (18.0 percent); Hispanic (16.9 percent); and Hawaiian and Pacific Islander (15.6 percent) had significantly higher rates of food insecurity than the all-household average. The prevalence of food insecurity for households headed by a White (8.0 percent) or an Asian (5.4 percent) reference person was significantly lower than the all-household average. The prevalence of very low food security followed a similar pattern and was statistically significantly different from the all-household prevalence for most race and ethnicity categories. It was not significantly different for Hawaiian and Pacific Islander households. Very low food security ranged from 1.6 percent for Asian households to 11.3 percent for Multiracial, American Indian-White households. Meaningful differences in food insecurity exist across and within racial ethnic groups. Related data are available in the USDA, Economic Research Service report Household Food Insecurity Across Race and Ethnicity in the United States, 2016–21, published in April 2024.