
Exchange rate values changing in top two markets for U.S. agricultural exports
- by William Johnson and Wendy Zeng
- 4/2/2024
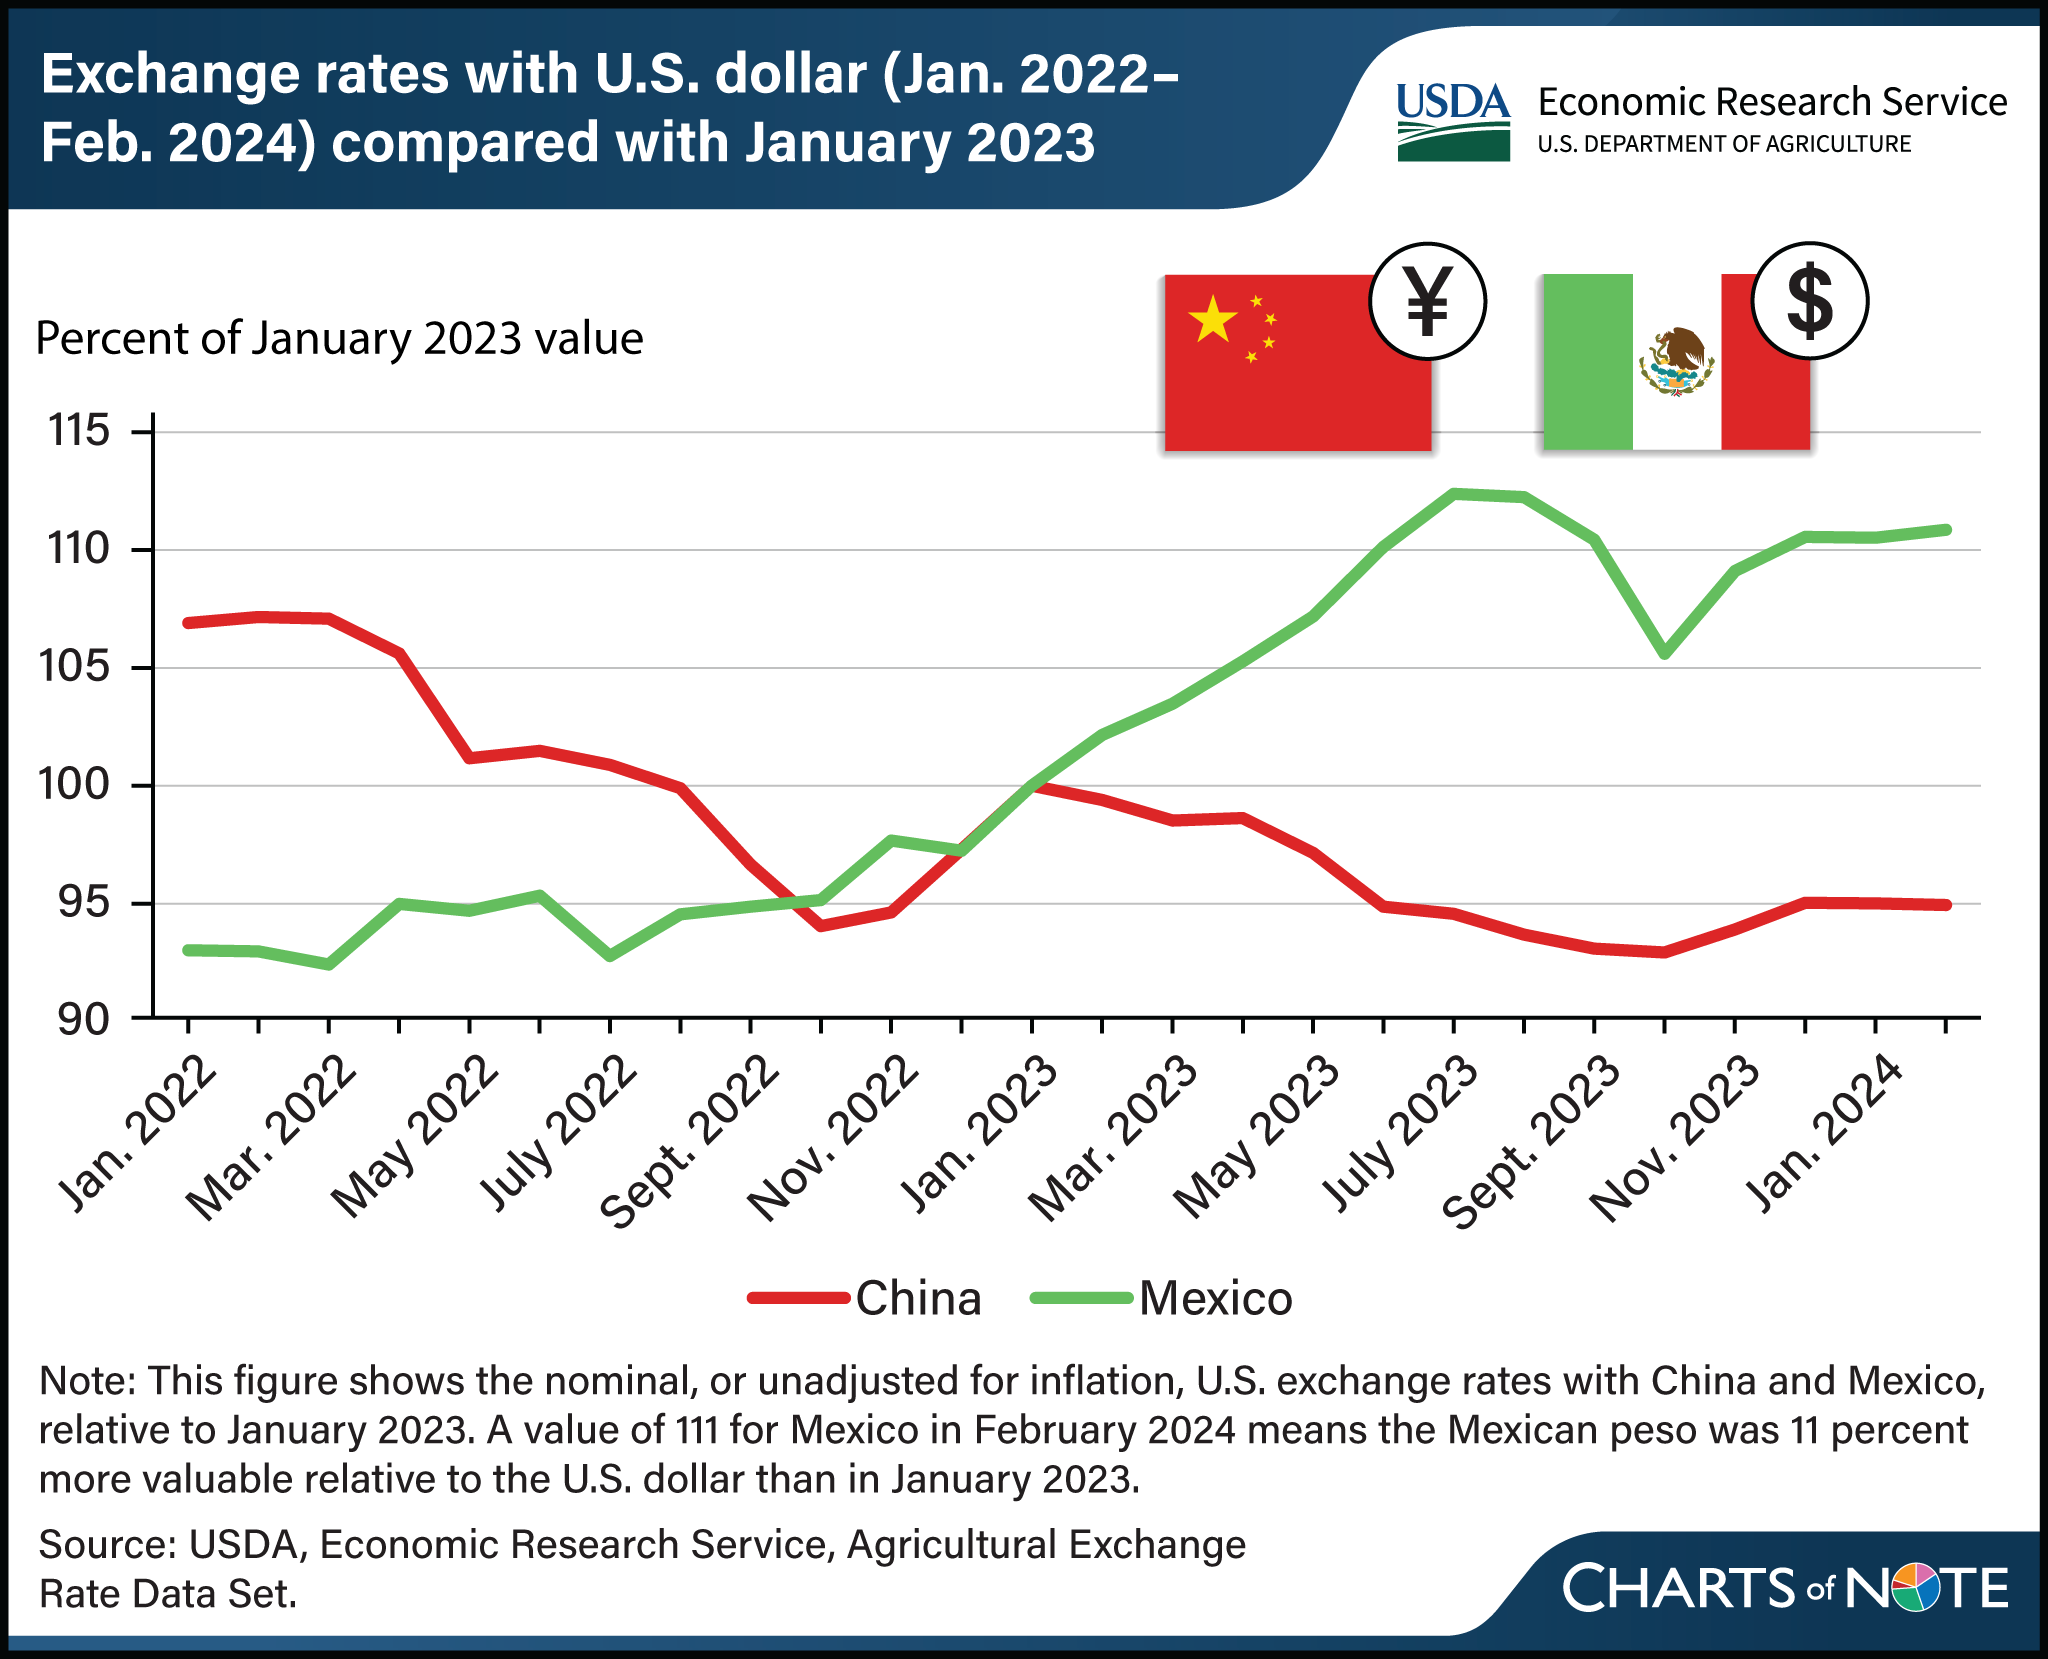
China and Mexico are the top two markets for U.S. agricultural exports by dollar value. Exchange rates are one of several factors that can influence U.S. agricultural trade. All else being equal, a stronger foreign currency favors U.S. exports to that country, and vice versa. For the past 2 years, China’s yuan has depreciated (has become less valuable) relative to the U.S. dollar, implying a weaker value of U.S. exports to China. The opposite has been true for the Mexican peso. The U.S. dollar appreciated in value relative to the currencies of many countries, including China, because of U.S. Federal Reserve interest rate increases during this period. The Mexican peso was an exception to this, as the Bank of Mexico increased interest rates more aggressively and earlier than the Federal Reserve did for U.S. interest rates. In addition, the Mexican government’s comparatively smaller stimulus response to the Coronavirus (COVID-19) pandemic in 2020 and 2021 and optimism regarding nearshoring—in which U.S. companies relocate operations to neighboring Mexico from China—has helped strengthen the peso, according to the Federal Reserve Bank of Dallas. From the perspective of U.S. farmers and agribusinesses, the decrease in the value of the yuan and increase in the value of the peso is generally associated with a decrease in export opportunities to China and an increase in export opportunities to Mexico. Not adjusting for inflation, U.S. agricultural exports to China decreased in value to $33.7 billion in fiscal year (FY) 2023 from $36.2 billion the previous year and are forecast to fall further to $28.7 billion in FY 2024. U.S. agricultural exports to Mexico increased in value from $28.0 billion to $28.2 billion from FY 2022 to 2023 and are forecast at a record high of $28.4 billion for FY 2024. This chart is drawn from USDA, Economic Research Service’s Agricultural Exchange Rate Data Set, February 2024.