
Increased migration from urban areas spurs rural population growth, while urban migration growth is international
- by John Cromartie and James C. Davis
- 3/7/2024
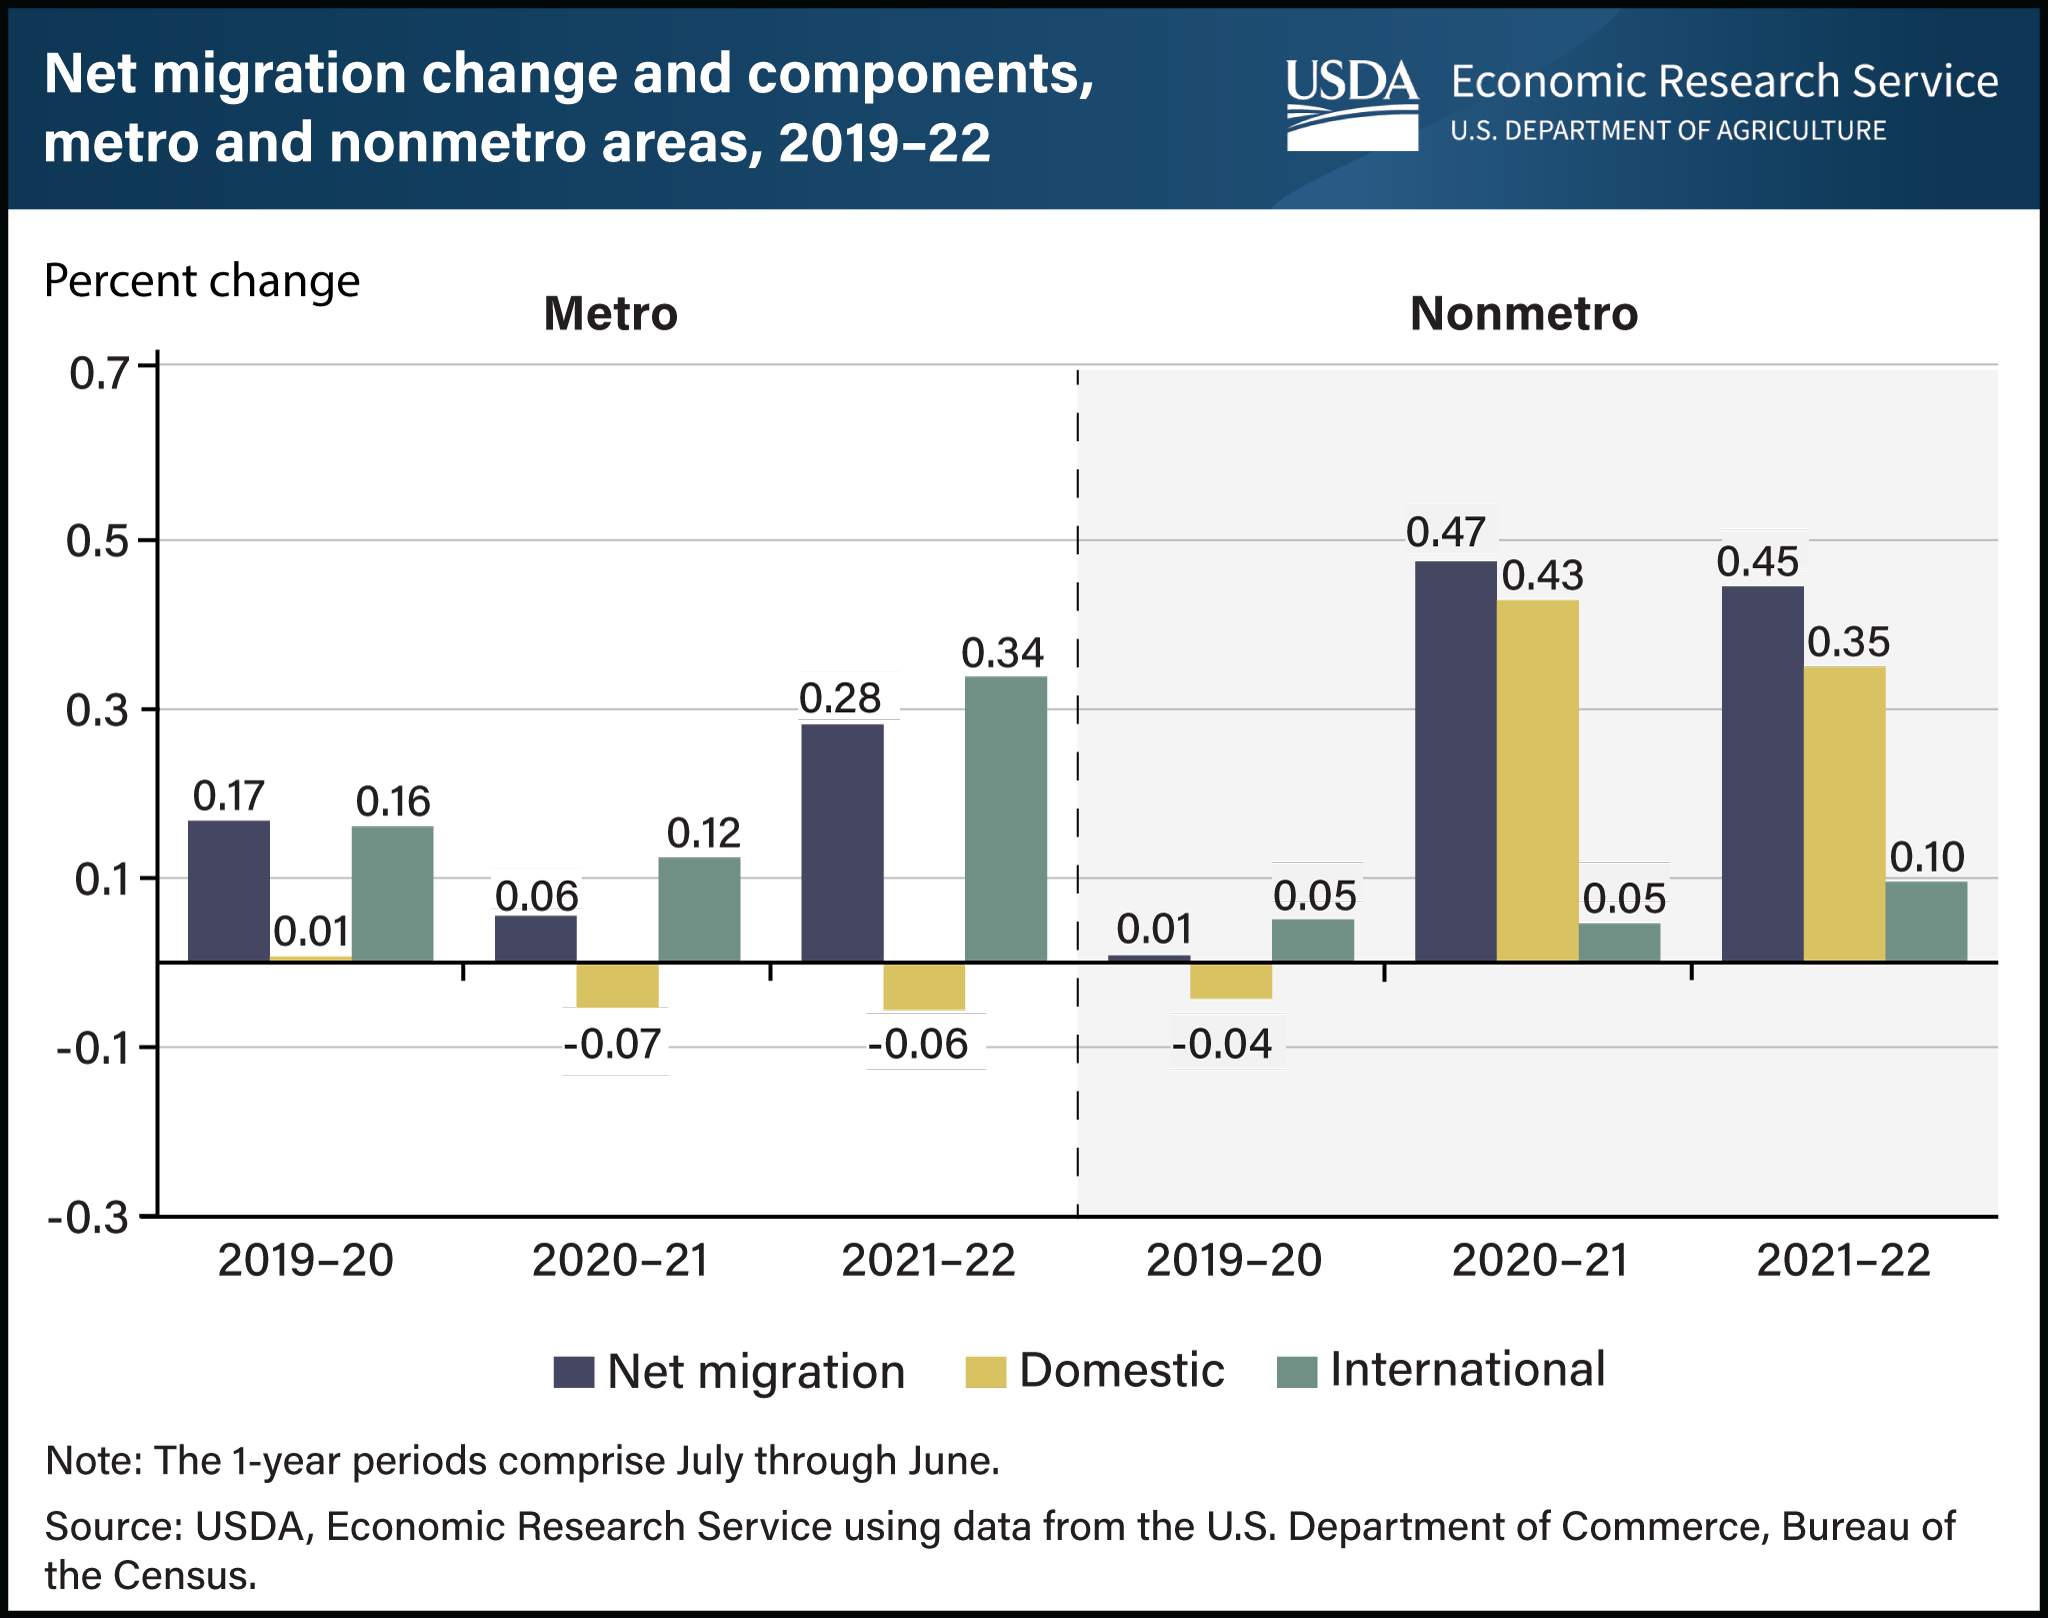
Both rural (nonmetro) and urban (metro) populations grew because of increased migration over the last few years; however, the sources of the increased migration are different. In 2020–21 and 2021–22, rural areas experienced an increase in population because more people moved from urban to rural areas than in the opposite direction, a reversal of domestic migration trends from the previous decade. Domestic migration occurs when people move among areas within the United States. Net domestic migration in rural areas jumped from near zero in 2019–20 to more than 0.35 percent in the last two years. Fear of exposure to Coronavirus (COVID-19) in urban areas and the subsequent increase in remote work contributed to this dramatic shift in migration patterns. Conversely, urban areas increased their population through migration from other countries. International migration to urban areas reached a peak of 0.34 percent in 2021–22. The growth in migration rates for both urban and rural areas are somewhat offset by elevated death rates (which are falling from pandemic highs) and lower birth rates. This chart is drawn from the USDA, Economic Research Service report Rural America at a Glance, published in November 2023.