
Food-at-home spending drops close to pre-COVID levels, while food-away-from-home spending remains high
- by Wilson Sinclair and Eliana Zeballos
- 1/22/2024
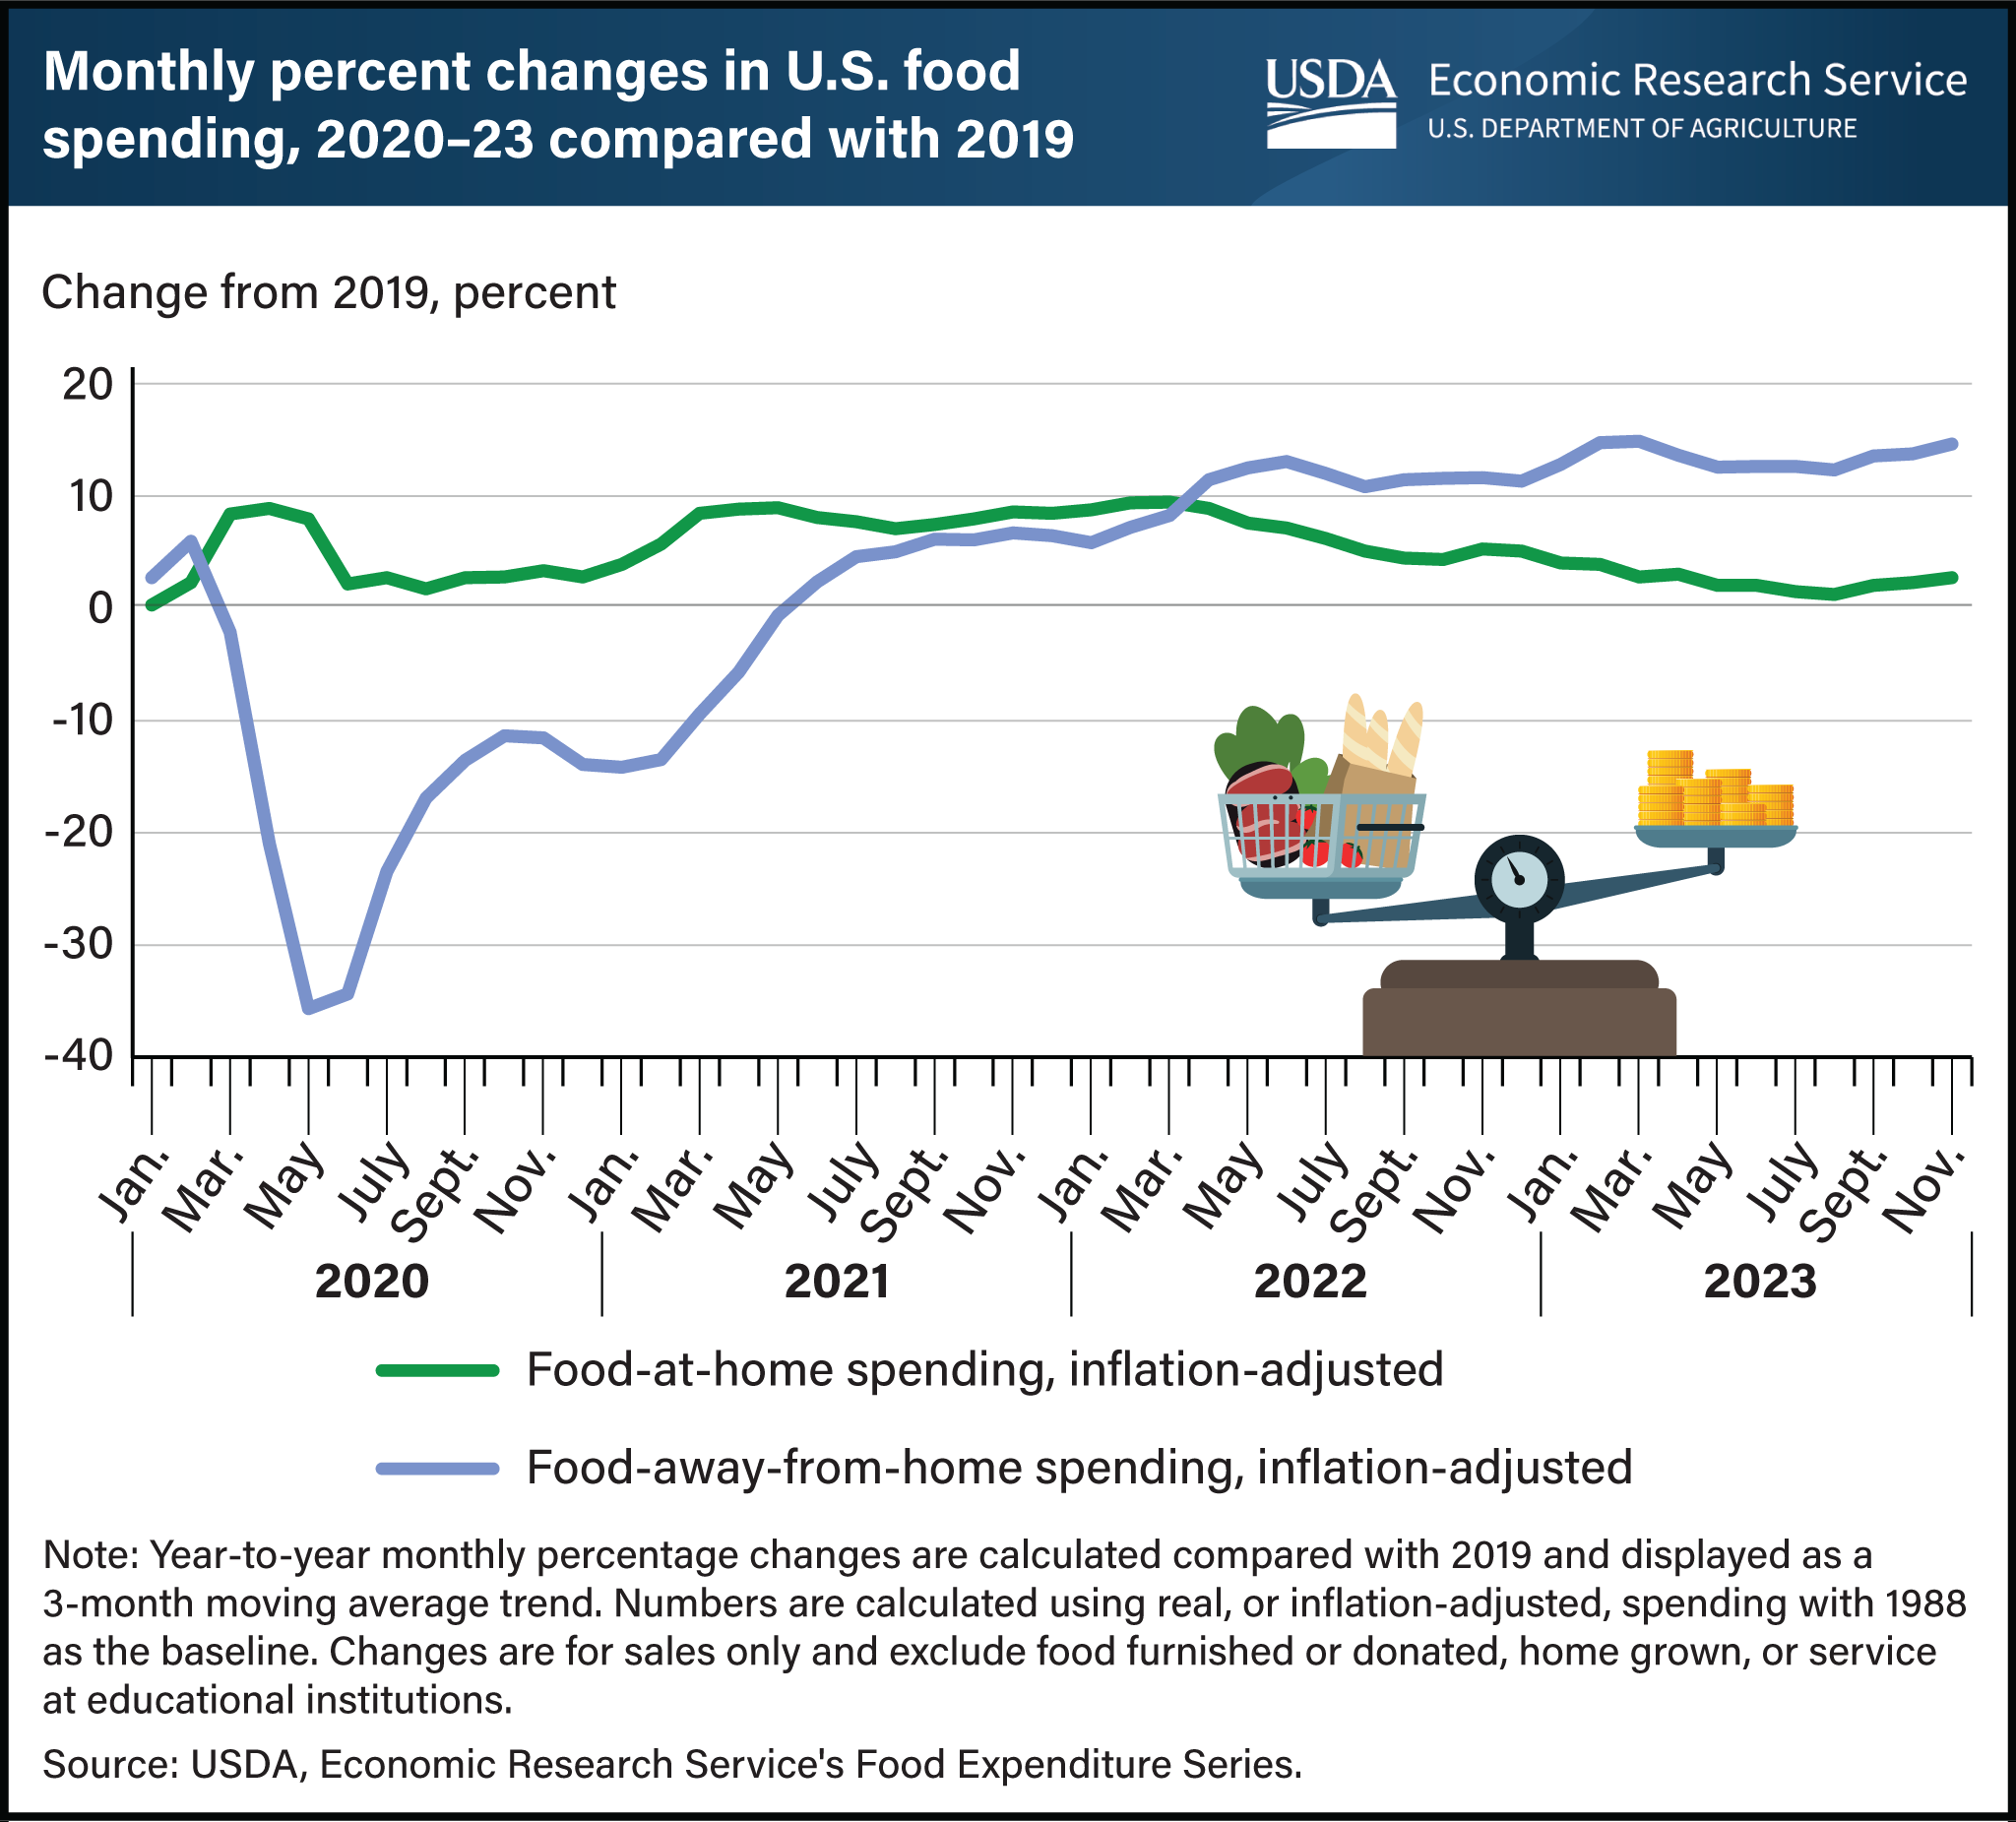
Following shifts in U.S. food spending during the Coronavirus (COVID-19) pandemic, food-at-home (FAH) spending was only 2.7 percent higher in November 2023 compared with November 2019, while food-away-from-home (FAFH) spending remained elevated at 14.6 percent higher. After an initial jump in inflation-adjusted FAH spending in March through May 2020, FAH spending leveled off, averaging just 2.8 percent higher in December 2020 compared with 2019. Even as FAH prices increased throughout 2021 and 2022, inflation-adjusted FAH spending increased as well, with monthly FAH spending in these years averaging 7.2 percent higher than the corresponding months in 2019. FAH spending has trended back toward prepandemic levels since the peak difference of 9.5 percent in March 2022. By contrast, FAFH spending initially fell significantly during the pandemic but reversed quickly and outpaced 2019 spending starting in June 2021. From June 2021 through December 2022, monthly inflation-adjusted FAFH spending averaged 8.7 percent higher than the corresponding months in 2019. FAFH spending peaked at 14.8 percent higher in March 2023 compared with March 2019. This chart combines and updates two charts from USDA, Economic Research Service’s (ERS) Amber Waves article U.S. Consumers Spent More on Food in 2022 Than Ever Before, Even After Adjusting for Inflation using data from the ERS Food Expenditure Series data product, updated January 19, 2024.