
In rural areas, population gains from net migration have exceeded losses from natural decrease
- by John Cromartie and James C. Davis
- 11/16/2023
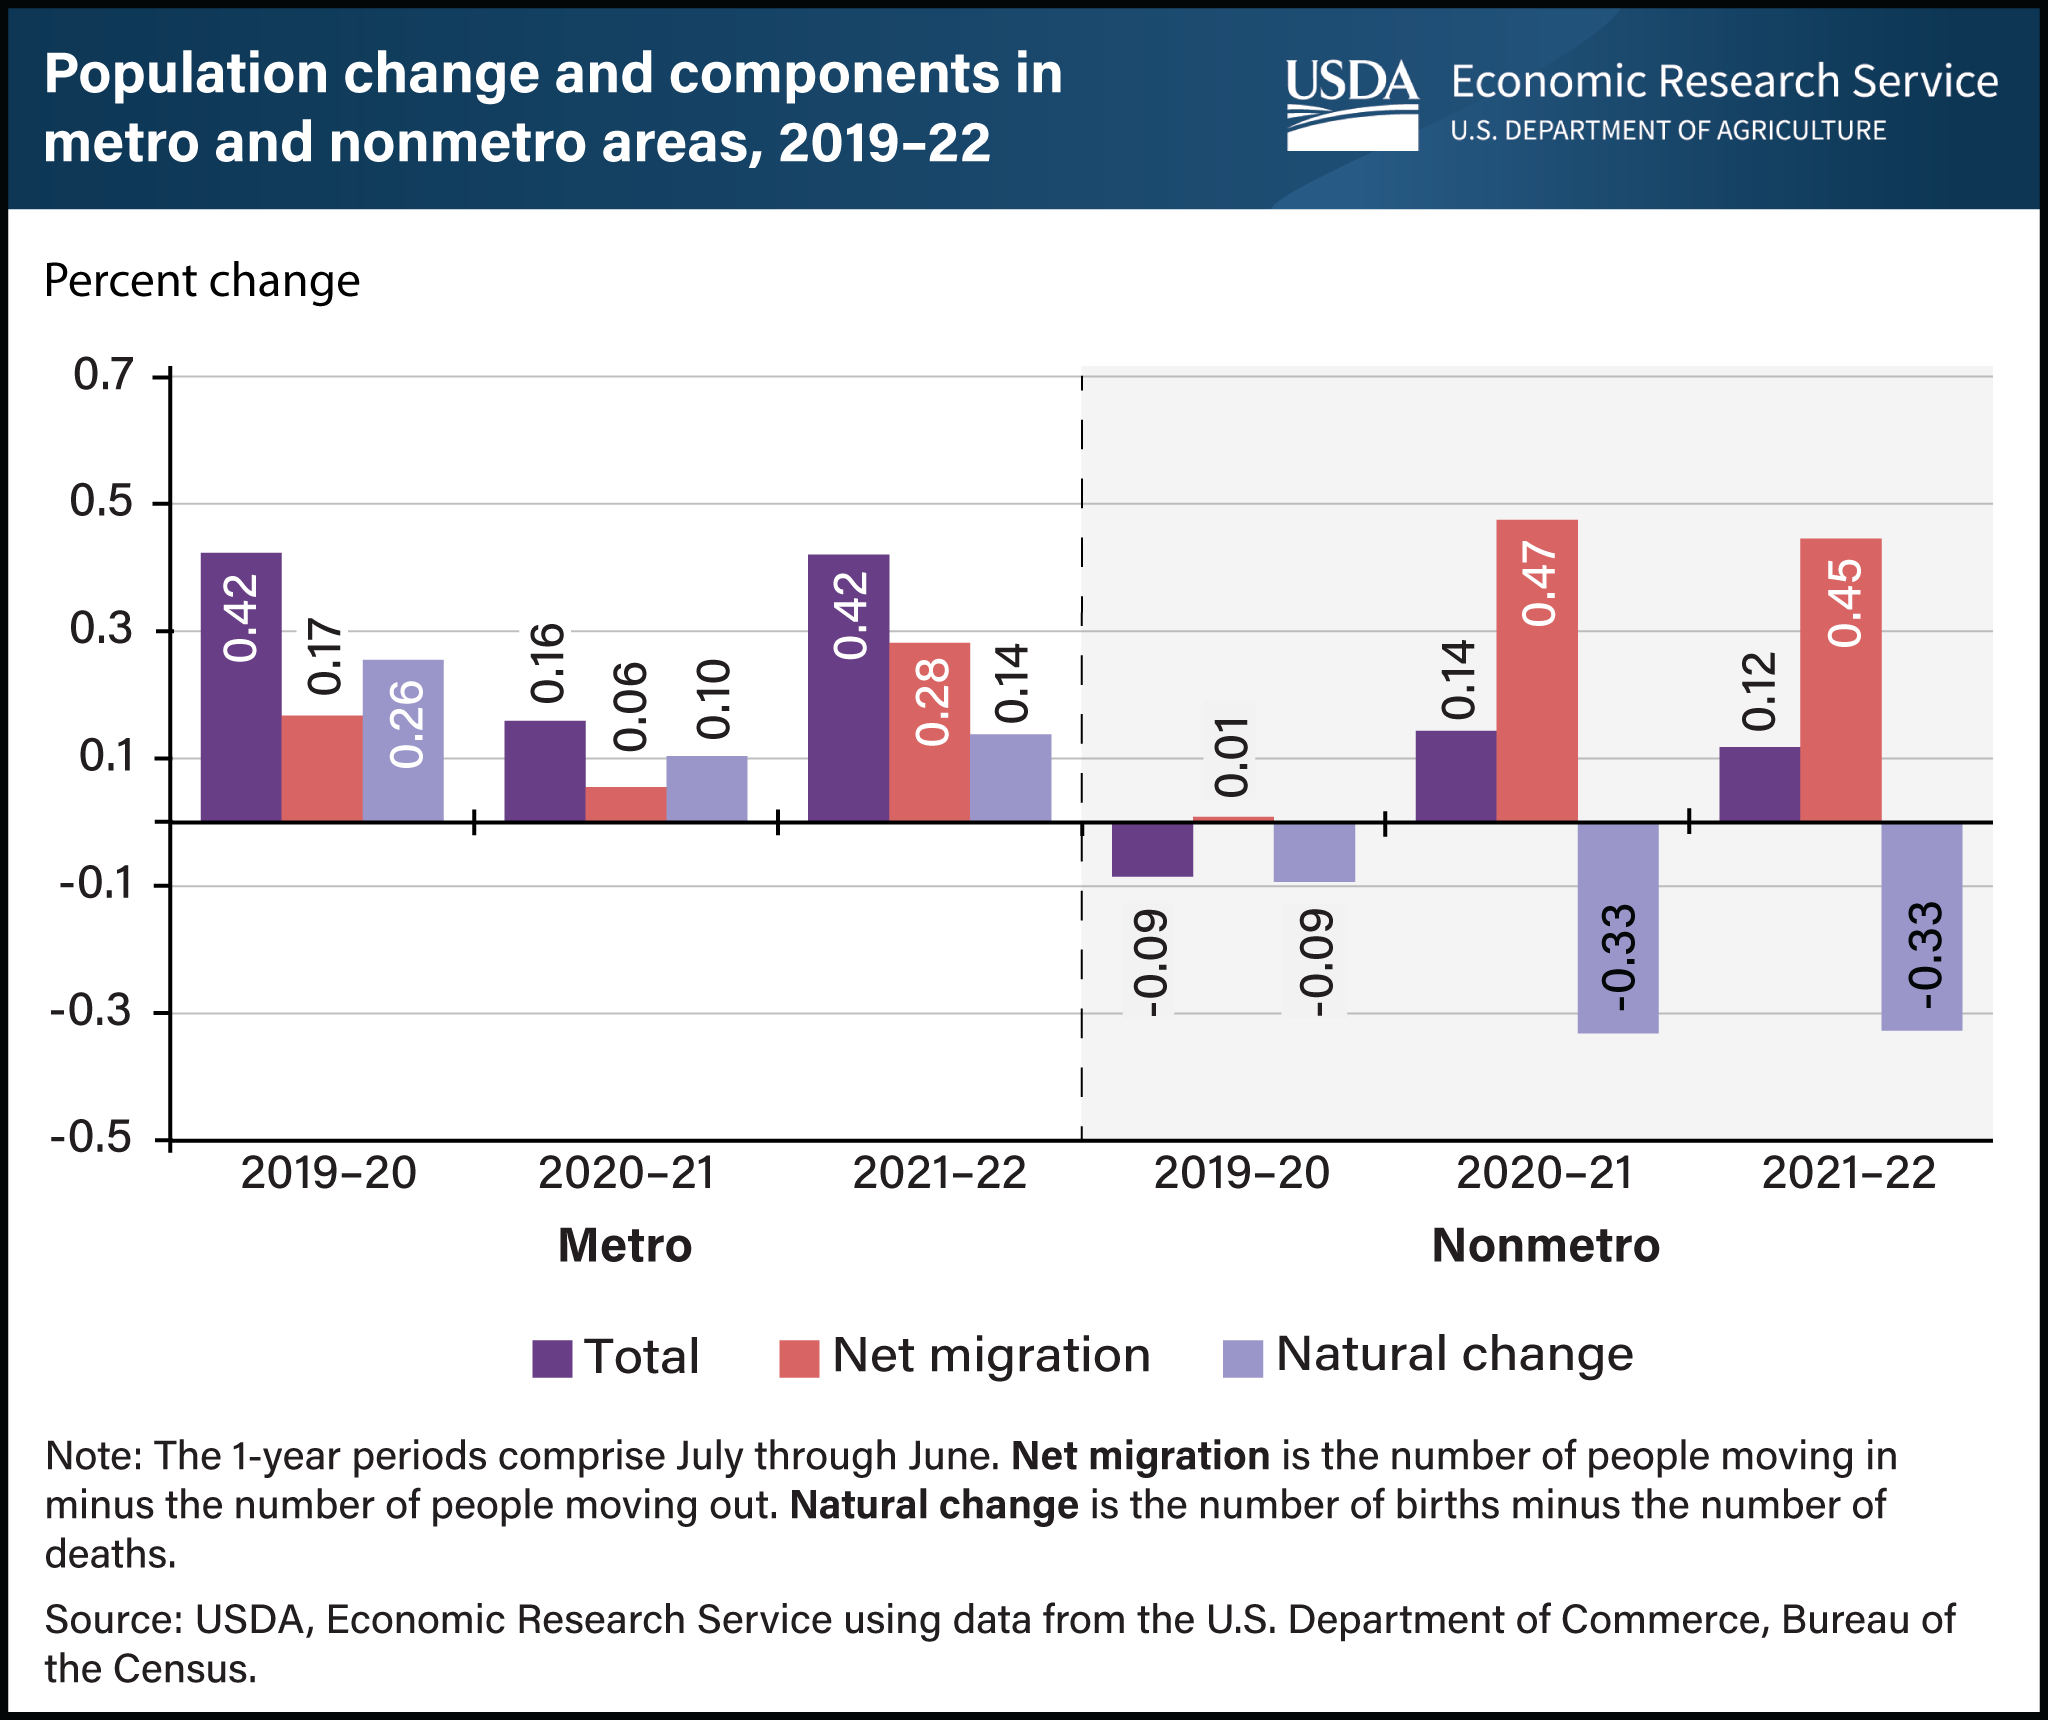
The rural (nonmetro) population growth that began with the Coronavirus (COVID-19) pandemic in 2020 continued into 2022, according to census population estimates. A sharp increase in net migration (the number of people moving in minus the number of people moving out) was the source of the growth. Migration to rural areas was 0.47 percent and 0.45 percent in 2020–21 and 2021–22, respectively, compared with 0.01 percent in the period before the pandemic. Overall, the rural population grew at 0.12 percent from mid-2021 through mid-2022 after accounting for the 0.33-percent decline caused by natural decrease (more deaths than births) in the same period. For rural areas, this recent growth is a reversal of population loss and near-zero migration in 2019–20 and comes after annual rural growth rates declined or were near zero in the previous 10 years. The population in metro areas followed a different trend in 2019–20 and 2020–21, dropping from 0.42 to 0.16 percent growth before returning to 0.42 percent in 2021–22. Roughly 46 million U.S. residents lived in rural areas in July 2022, making up 13.8 percent of the population. This chart is drawn from the ERS report Rural America at a Glance, published in November 2023.