
Food insecurity ranged from 6.2 percent in New Hampshire to 16.6 percent in Arkansas in 2020–22
- by Laura J. Hales
- 10/30/2023
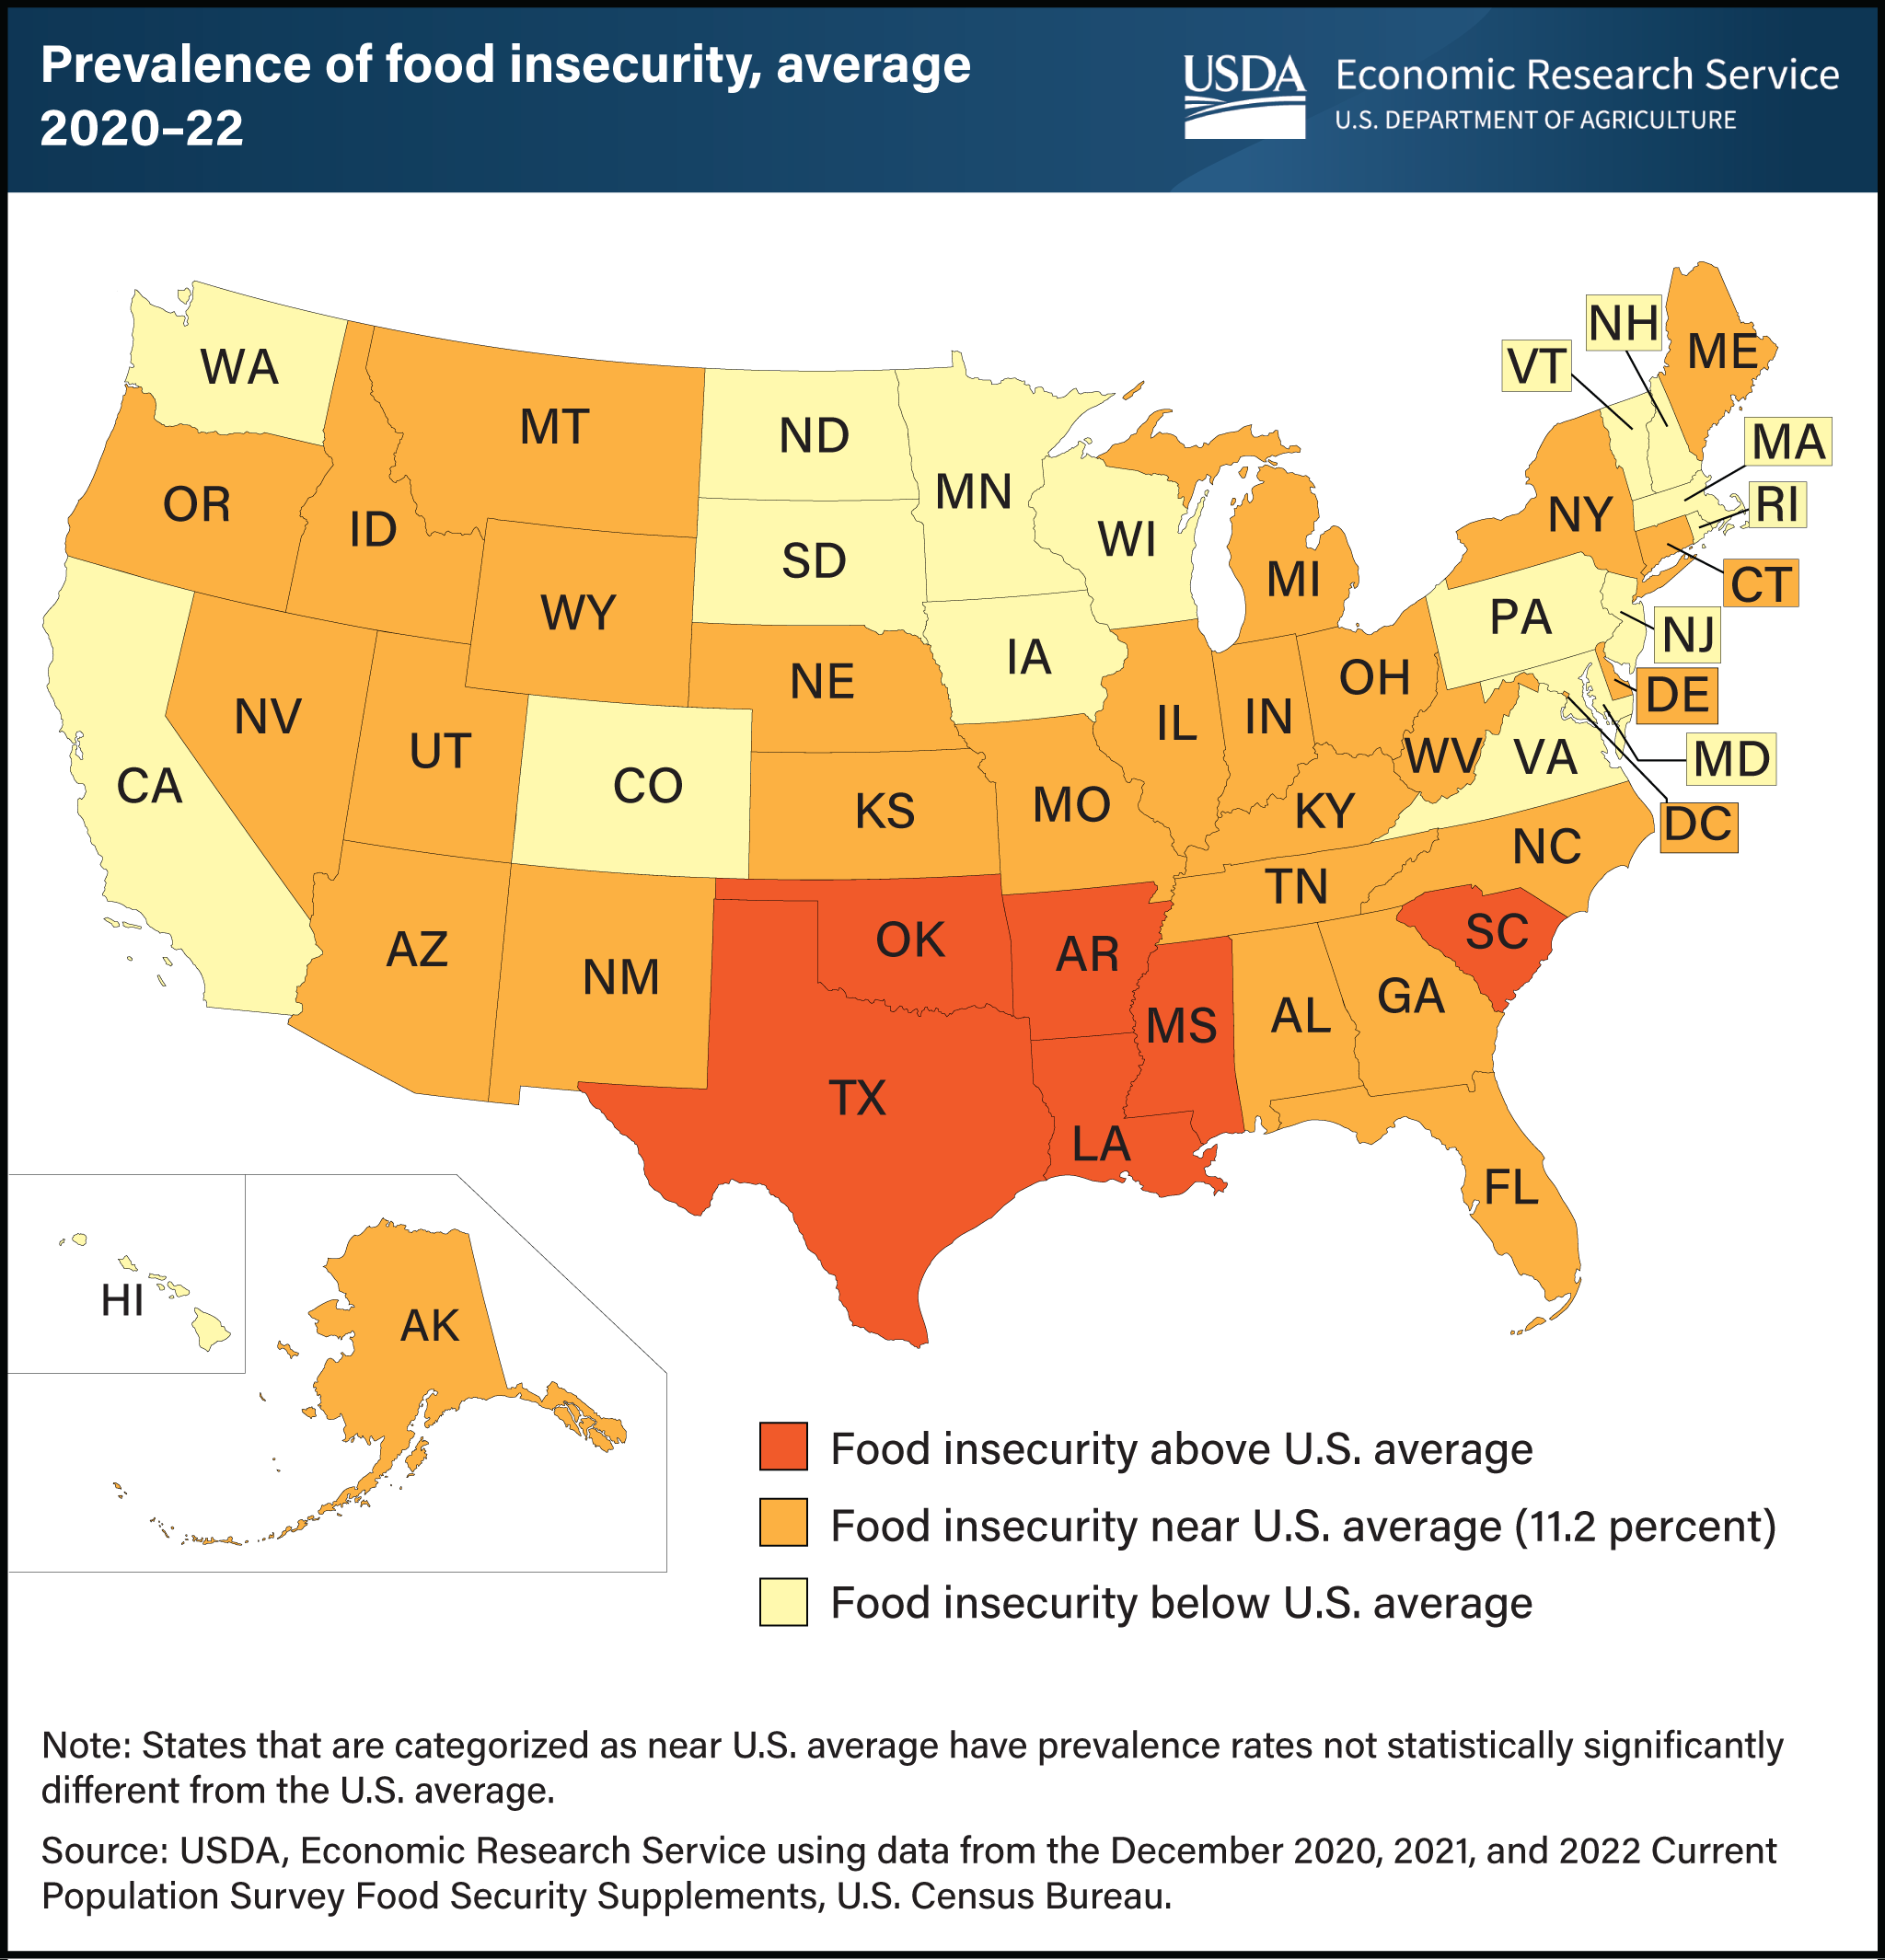
Food-insecure households sometimes have difficulty providing enough food for all their members because they lack resources. USDA, Economic Research Service (ERS) monitors the extent of food insecurity in U.S. households at the national and State levels through an annual U.S. Census Bureau survey. State-level estimates are obtained by averaging 3 years of data to generate a larger sample size in each State. This provides more precise estimates and more power to detect differences across States. The estimated prevalence rates of food insecurity during 2020–22 ranged from 6.2 percent in New Hampshire to 16.6 percent in Arkansas. The estimated national 3-year average for all States was 11.2 percent. The prevalence of food insecurity was statistically significantly higher than the national average in 6 States (AR, LA, MS, OK, SC, and TX) and statistically significantly lower than the national average in 17 States (CA, CO, HI, IA, MA, MD, MN, ND, NH, NJ, PA, RI, SD, VA, VT, WA, and WI). In the remaining 27 States and the District of Columbia, differences from the national average were not statistically significant. An interactive food insecurity map can be found on ERS’s Interactive Charts and Highlights page that allows users to view two measures of food insecurity over multiple years for each State. Users can see State trends in food insecurity, how States compare with national food insecurity prevalence rates, and how States compare with one another. This map appears on ERS’s Key Statistics & Graphics page.