
Distribution of census tract mean Road Terrain Ruggedness Index values.
- by Elizabeth A. Dobis
- 9/8/2023
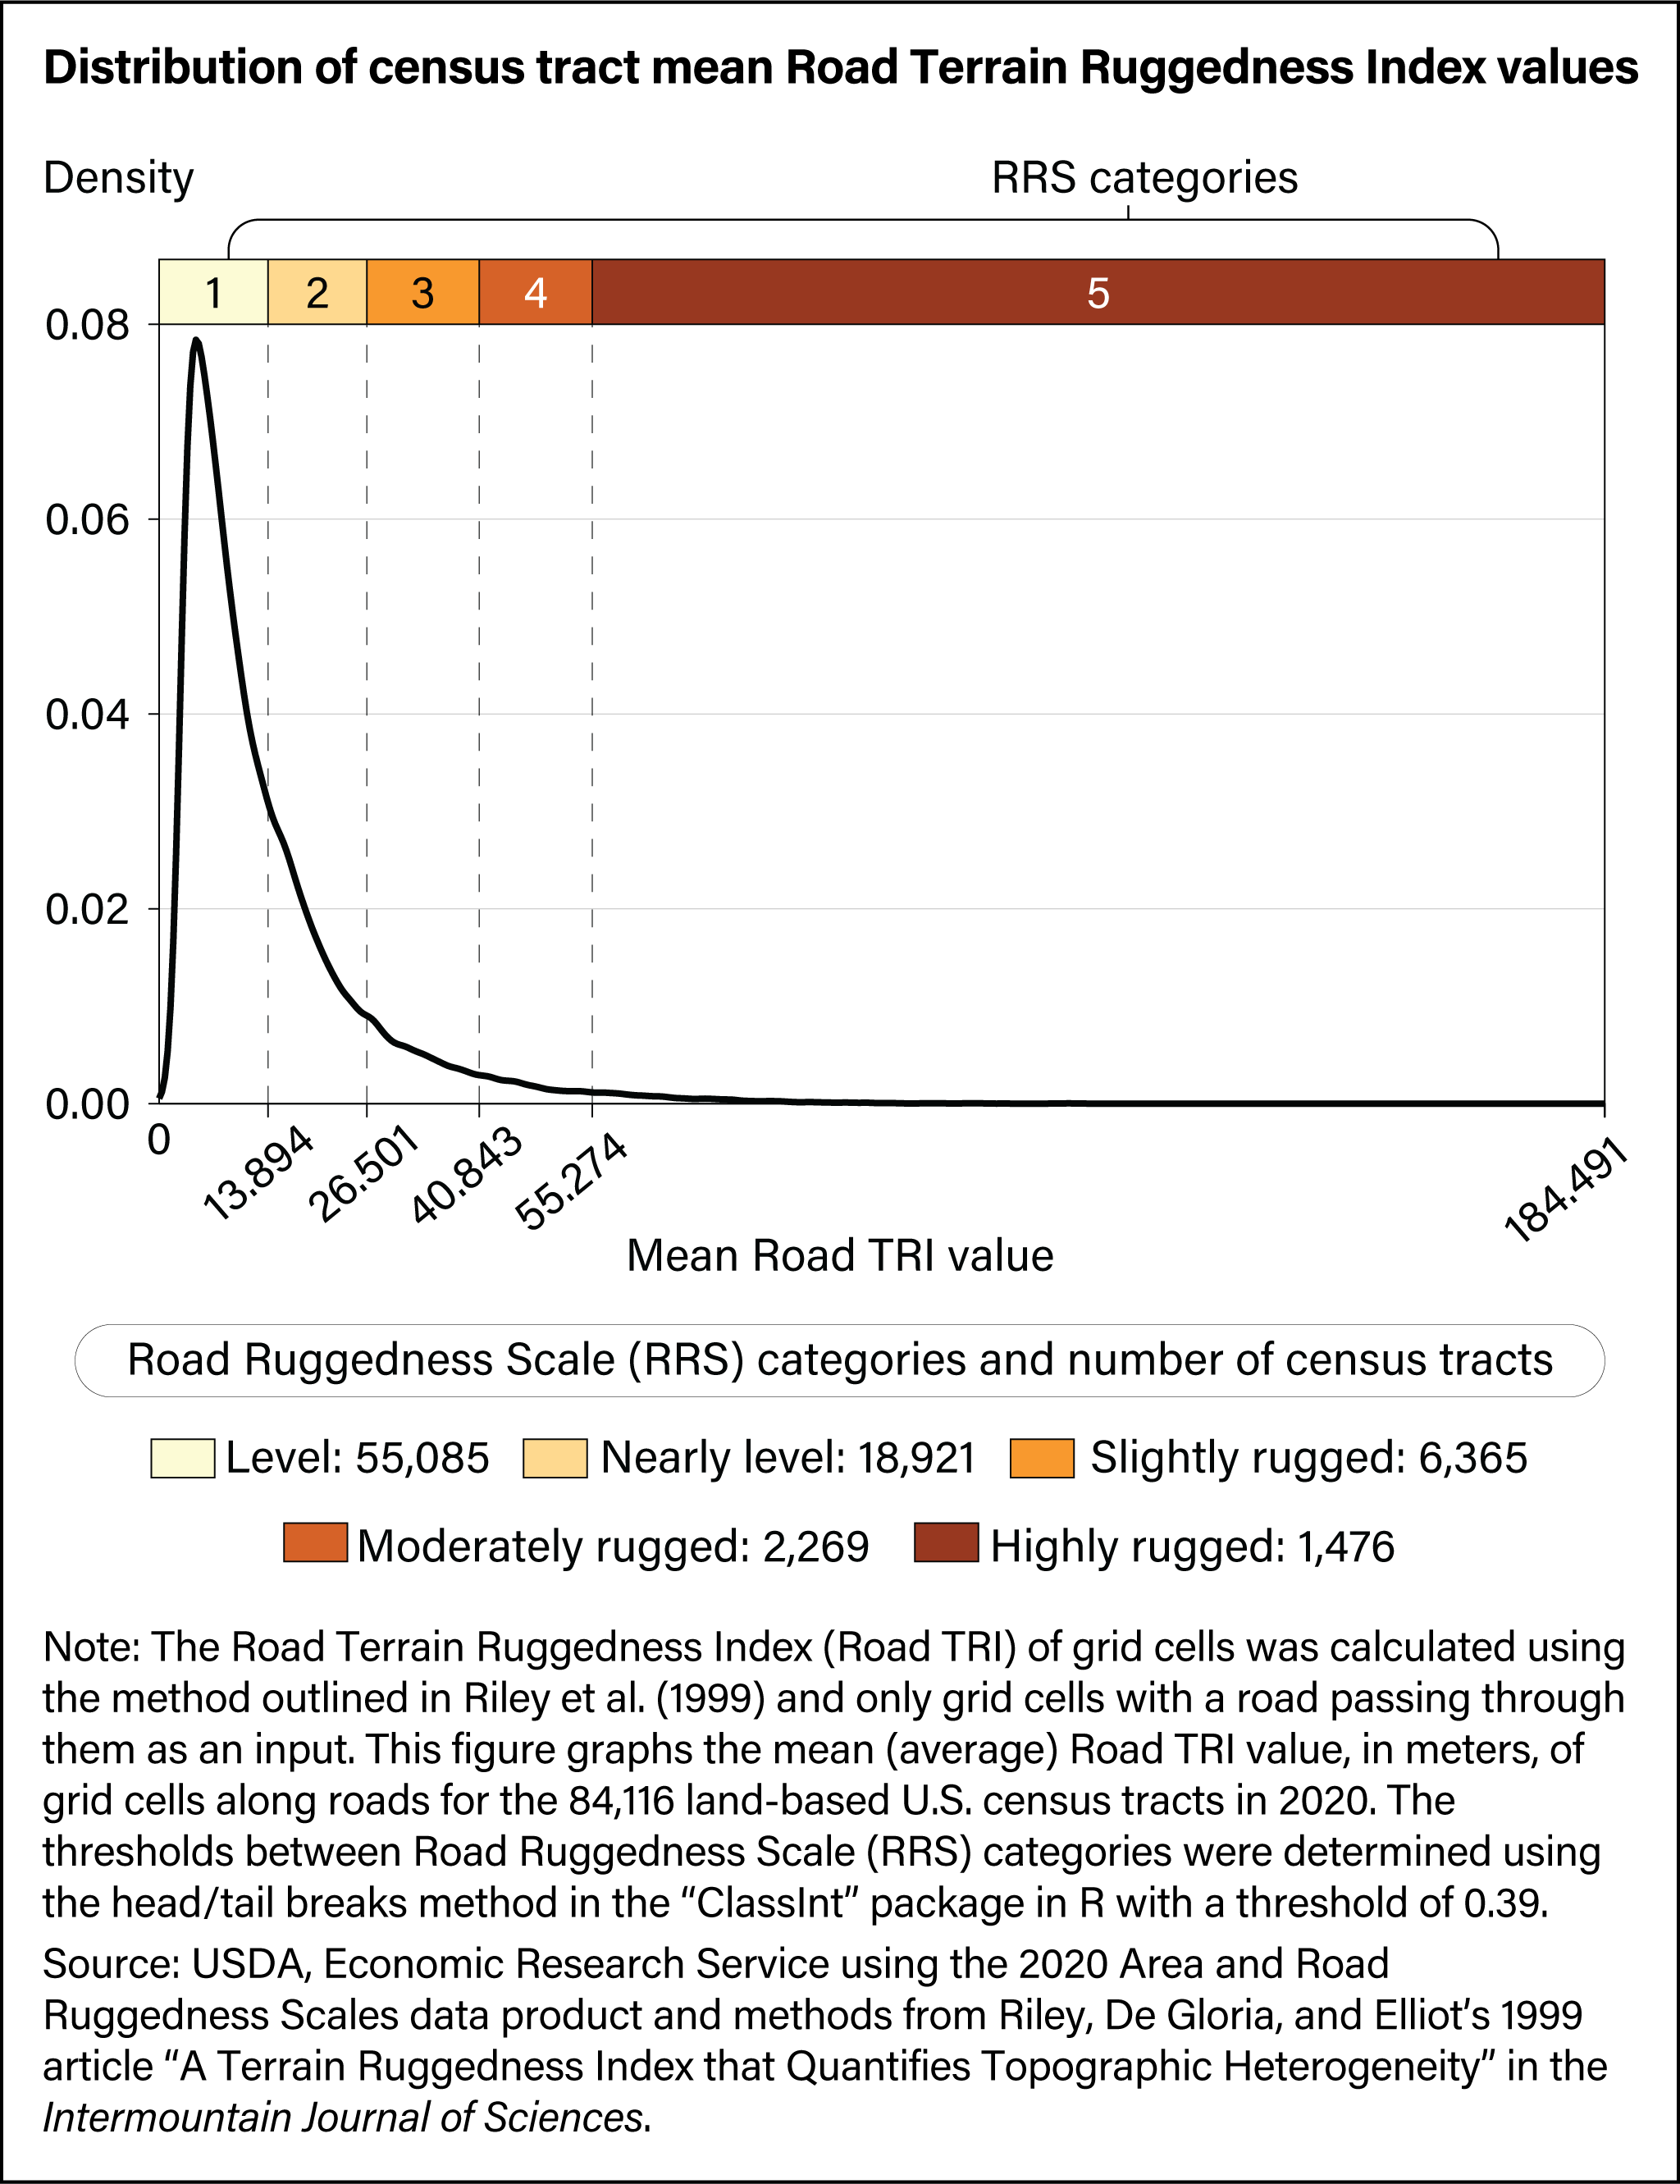
The Road Terrain Ruggedness Index (Road TRI) of grid cells was calculated using only grid cells with a road passing through them as an input. This figure graphs the mean (average) Road TRI value, in meters, of grid cells along roads for the 84,116 land-based U.S. census tracts in 2020. To create the categorical ARS and RRS, USDA ERS researchers employed the head/tail breaks classification method. The head/tail breaks method uses an iterative process that first partitions data into two groups based on the mean. Initially, the entire dataset is divided into two groups: one with values below the mean, which has a large number of low TRI values, and another (the tail) with values above the mean. The method then further divides the tail into two groups around the mean of this second group. This process continues, partitioning the remaining tail in the same manner, until the distribution is no longer considered heavy tailed (i.e., until the mean is more centrally located among the data values).