
Share of income spent on food increased 13 percent in 2022, led by food-away-from-home spending
- by Eliana Zeballos and Wilson Sinclair
- 8/14/2023
Errata: On August 16, this chart was updated with the correct year for when a similar level of income was previously spent on food. No other data were affected.
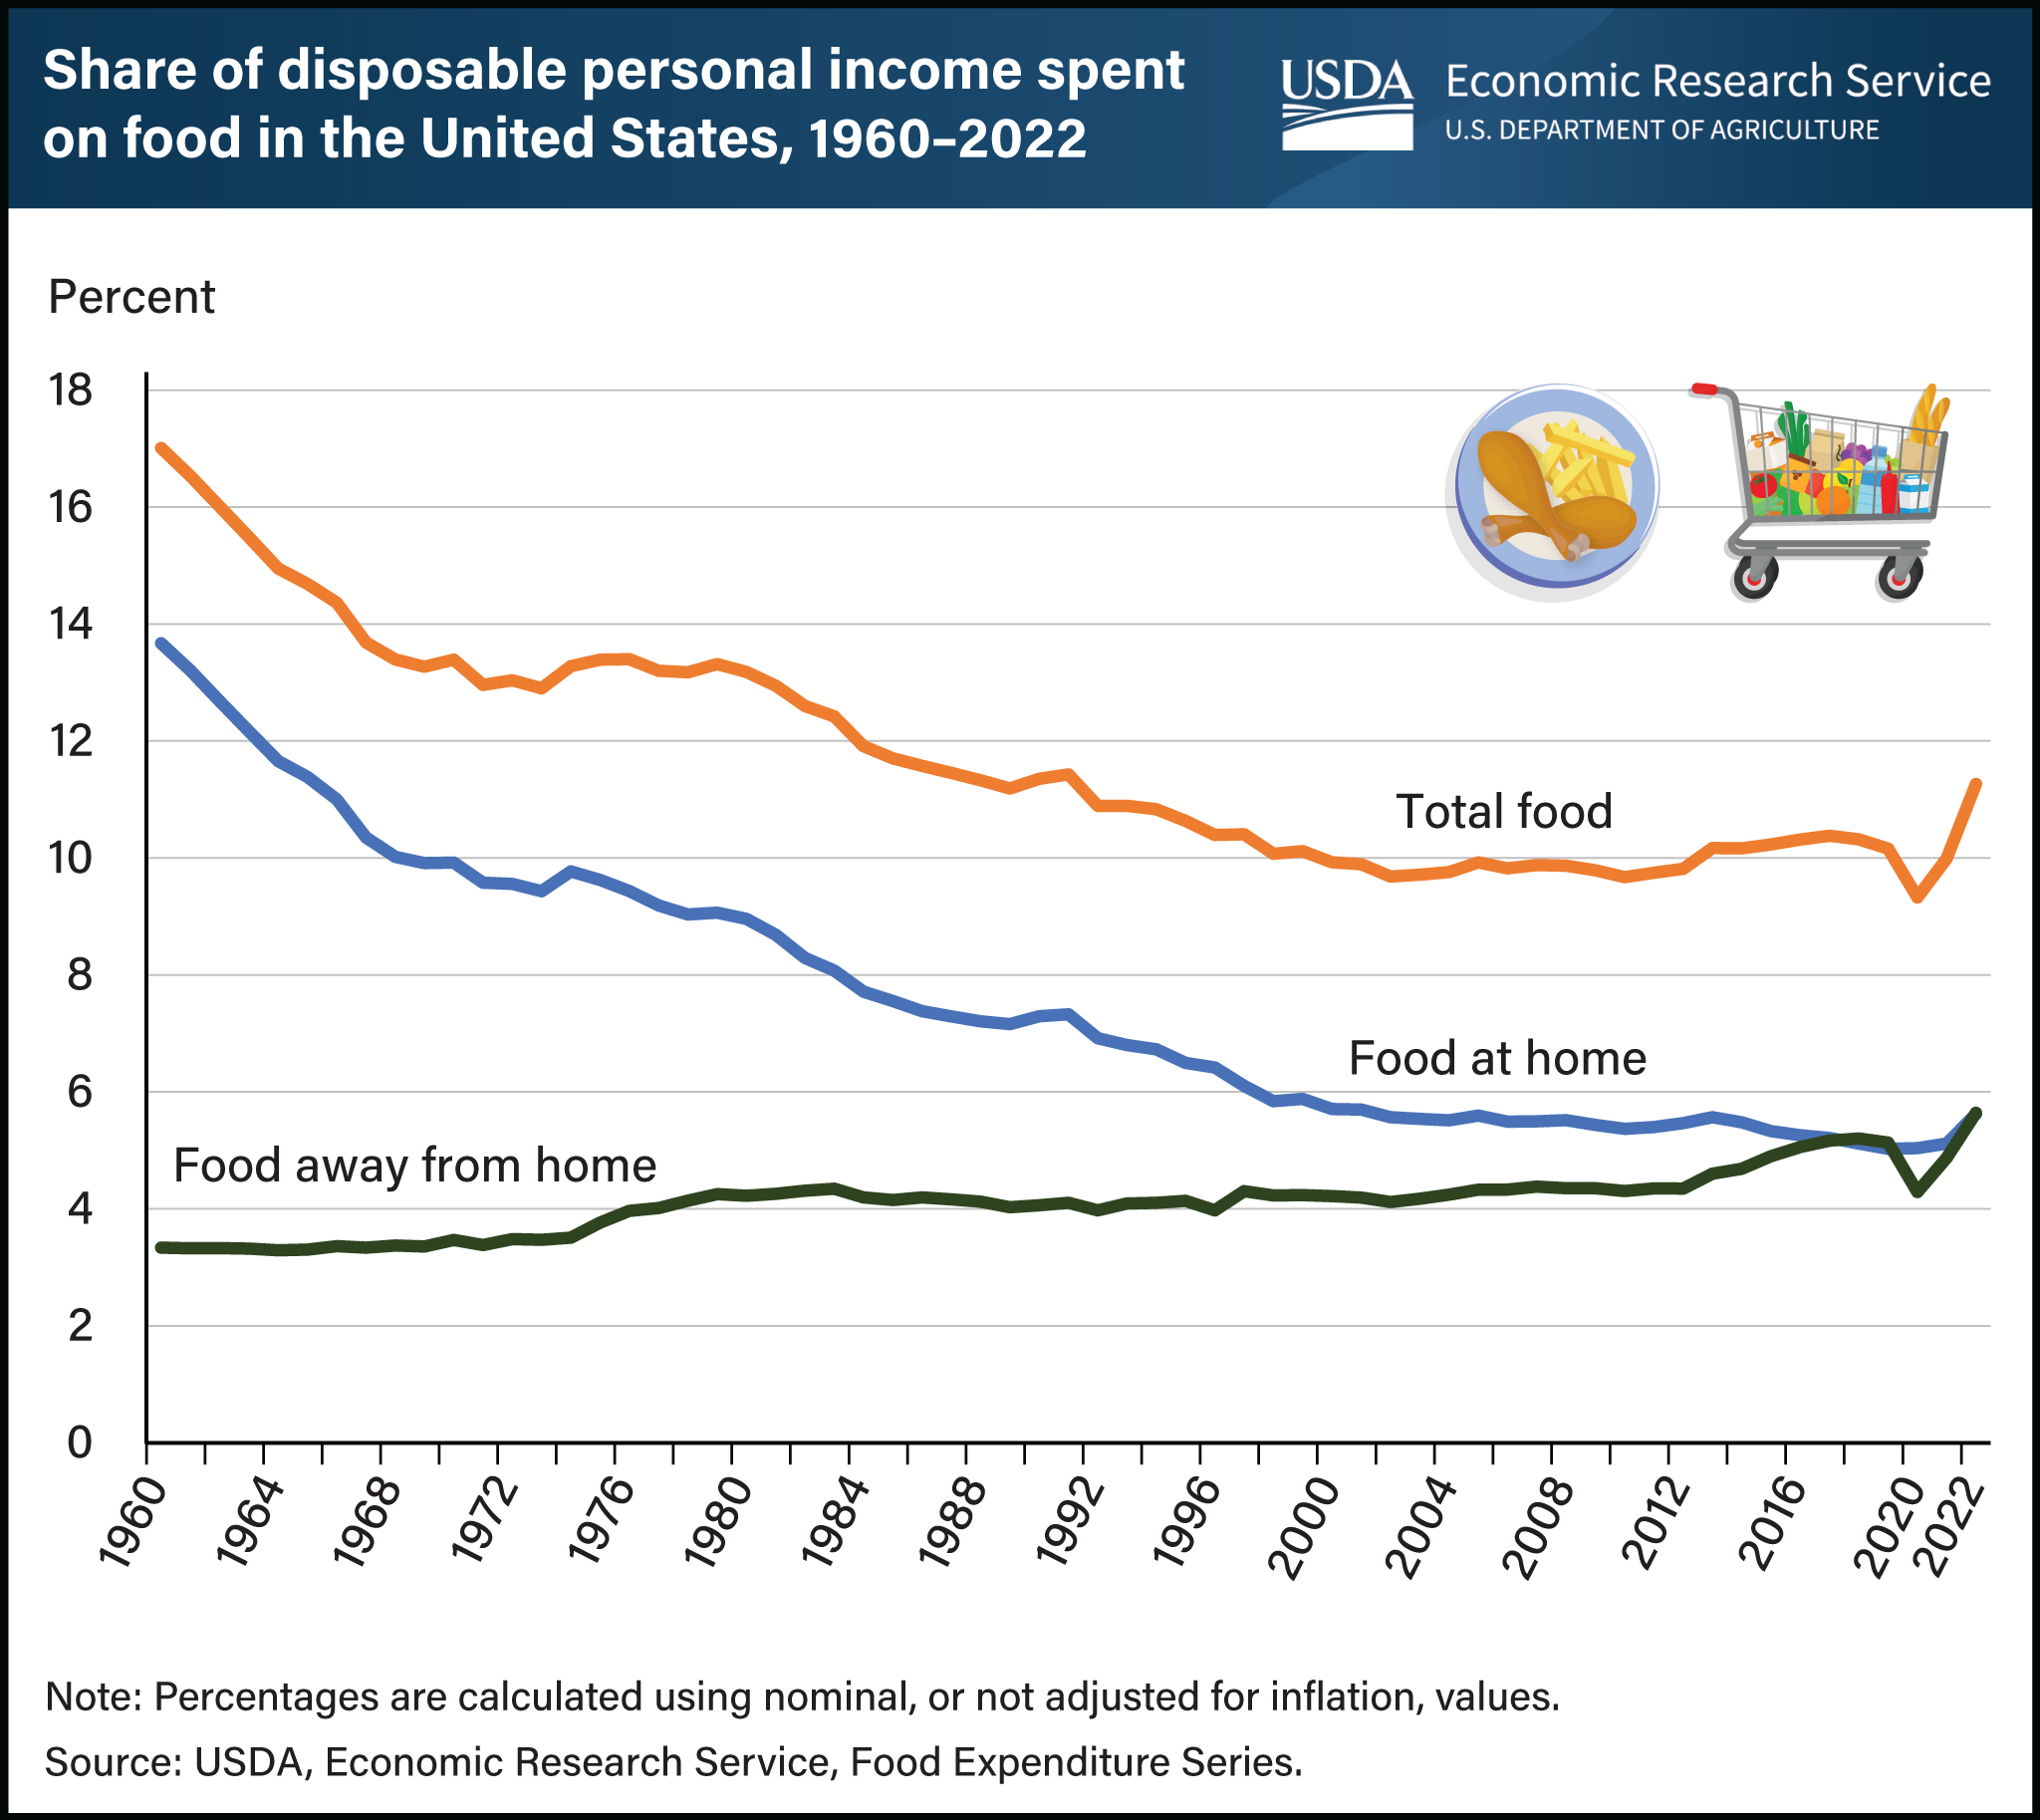
U.S. consumers spent an average of 11.3 percent of their disposable personal income (DPI) on food in 2022, a level not observed since 1991. DPI is the amount of money U.S. consumers have left to spend or save after paying taxes. Consumers spent 5.62 percent of their incomes on food at supermarkets, convenience stores, warehouse club stores, supercenters, and other retailers (food at home) in 2022 and 5.64 percent on food at restaurants, fast-food establishments, schools, and other places offering food away from home. In 2022, the share of DPI spent on total food had the sharpest annual increase (12.7 percent). This followed an 8.2-percent decline, the sharpest annual drop in total food spending since 1967, during the first year of the Coronavirus (COVID-19) pandemic in 2020. The recent volatility in spending was driven by consumers’ sudden drop in eating out at the beginning of the pandemic followed by a return to food-away-from-home purchases as pandemic-related restrictions and concerns eased. The chart is drawn from USDA, Economic Research Service’s Ag and Food Statistics: Charting the Essentials and Food Expenditure Series data product, updated July 2023.