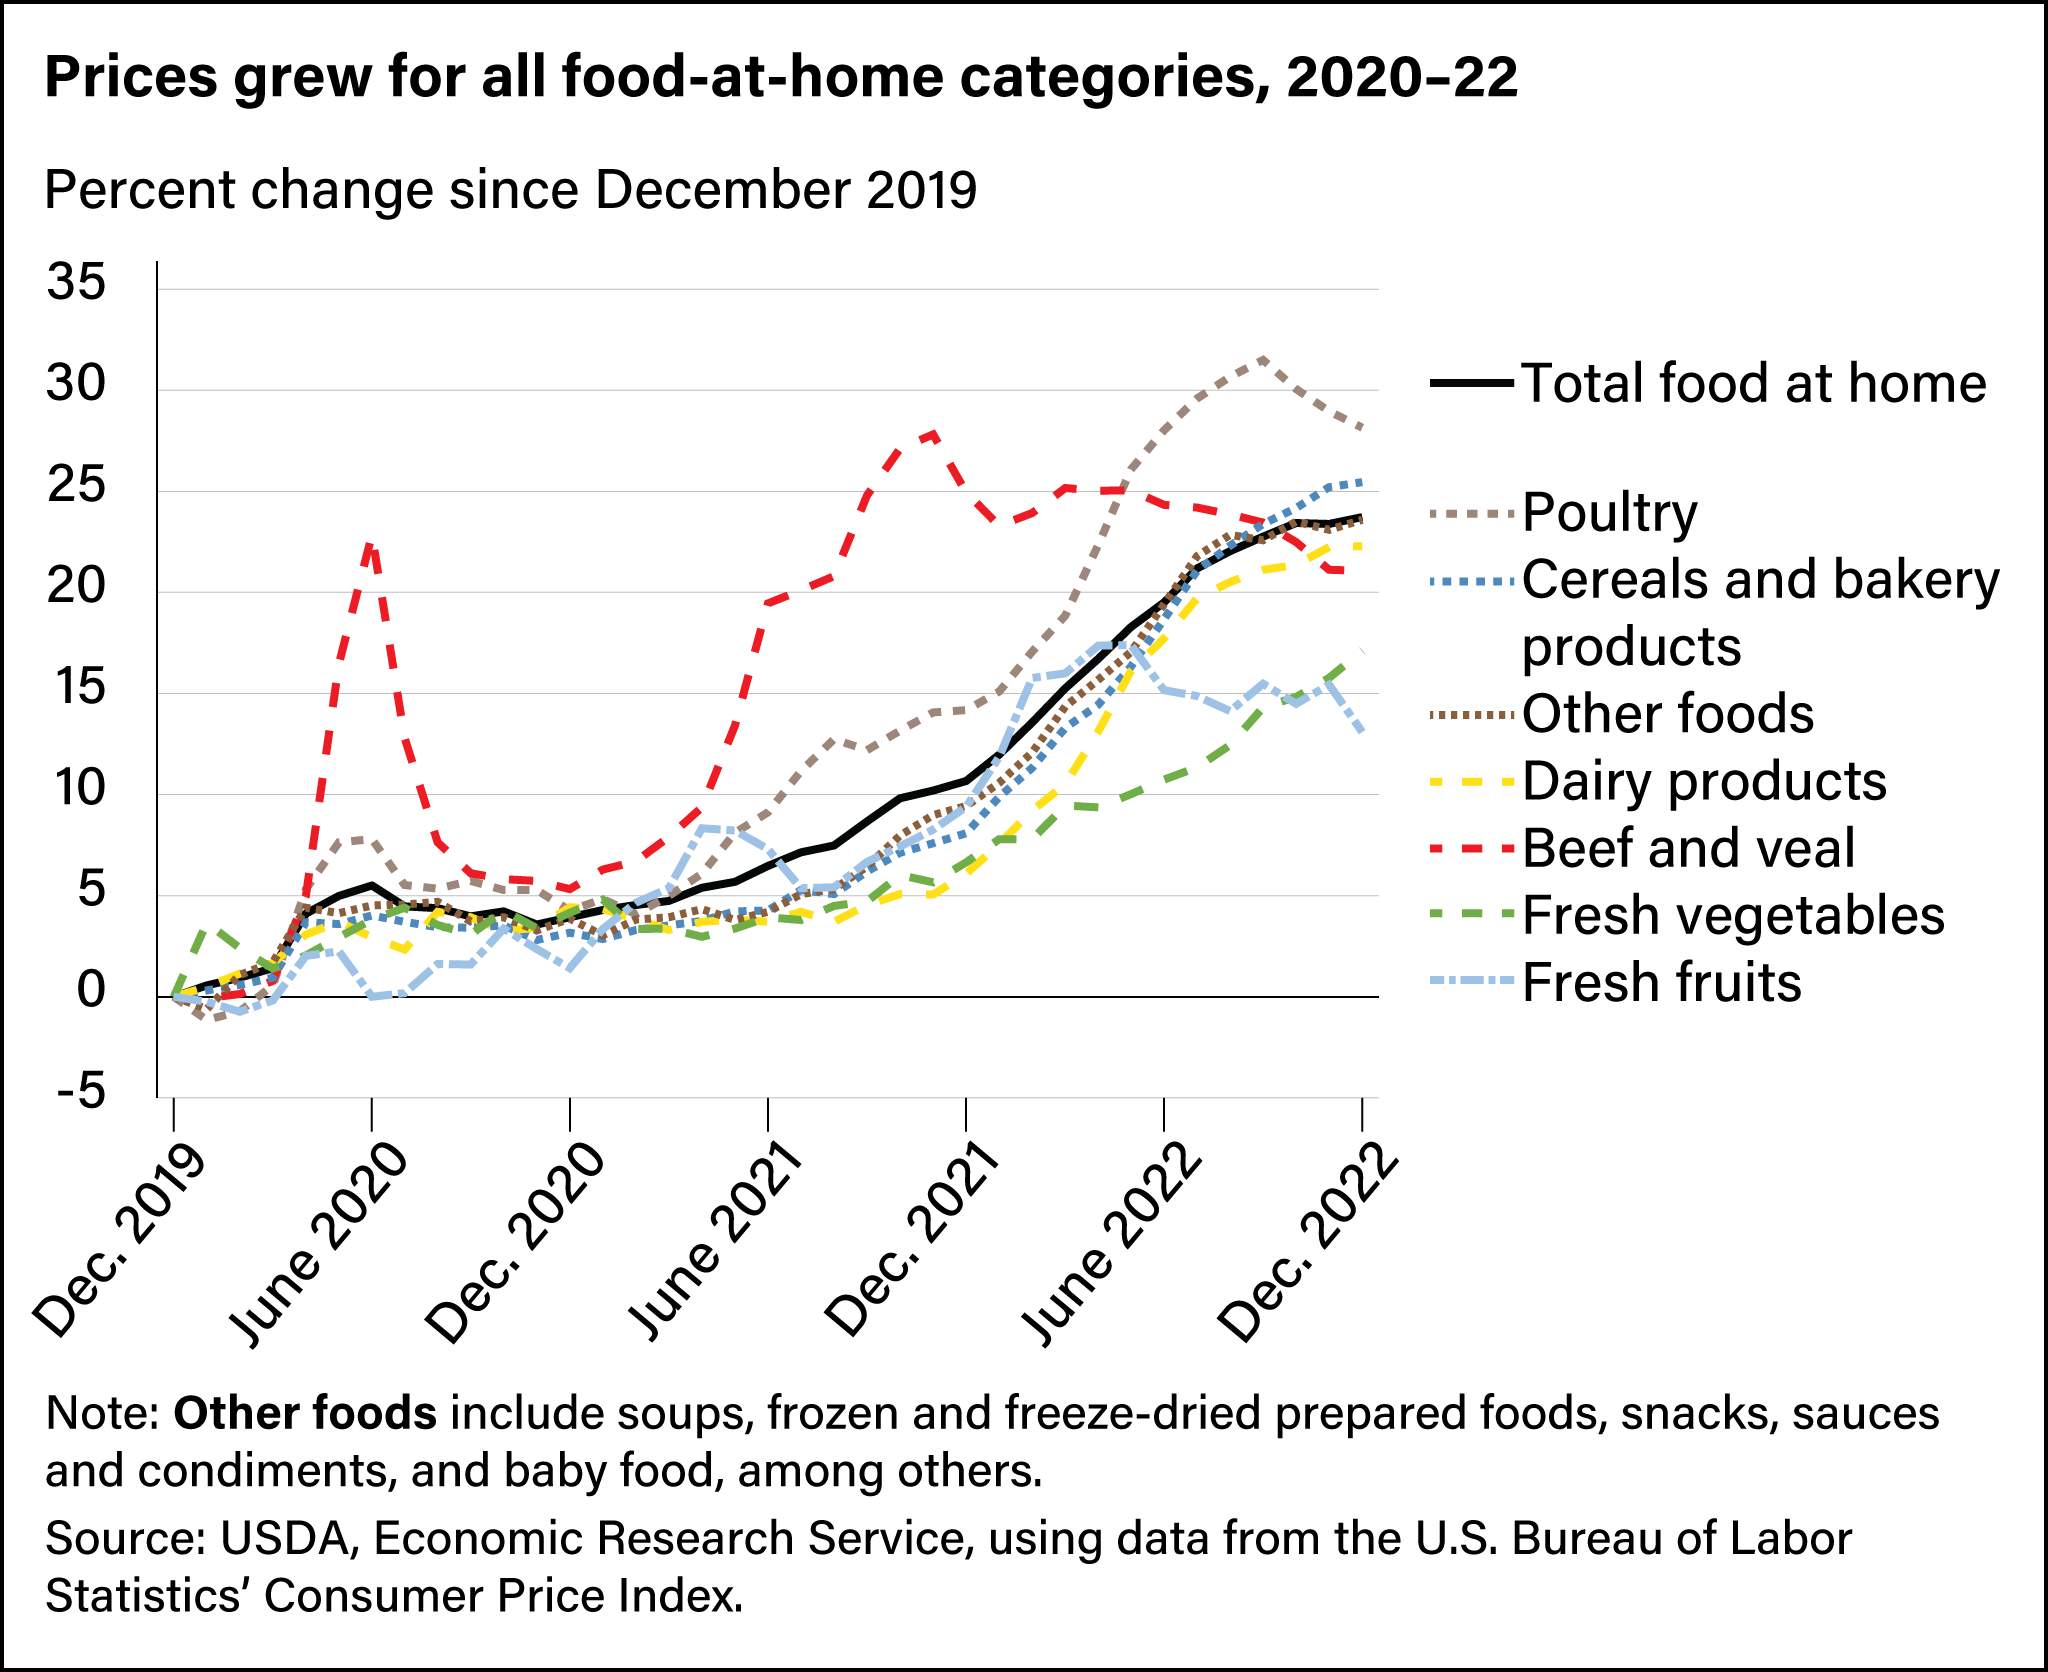
Prices grew for all food-at-home categories, 2020–22
- by Megan Sweitzer
- 7/10/2023

Line chart showing percent changes for total food at home, poultry, cereals and bakery products, other foods, dairy products, beef and veal, fresh vegetables, and fresh fruits from December 2019 to December 2022.
