
Since early 2000s, growth in U.S. soybean planted acreage has outpaced corn and wheat
- by Kate Vaiknoras
- 6/15/2023
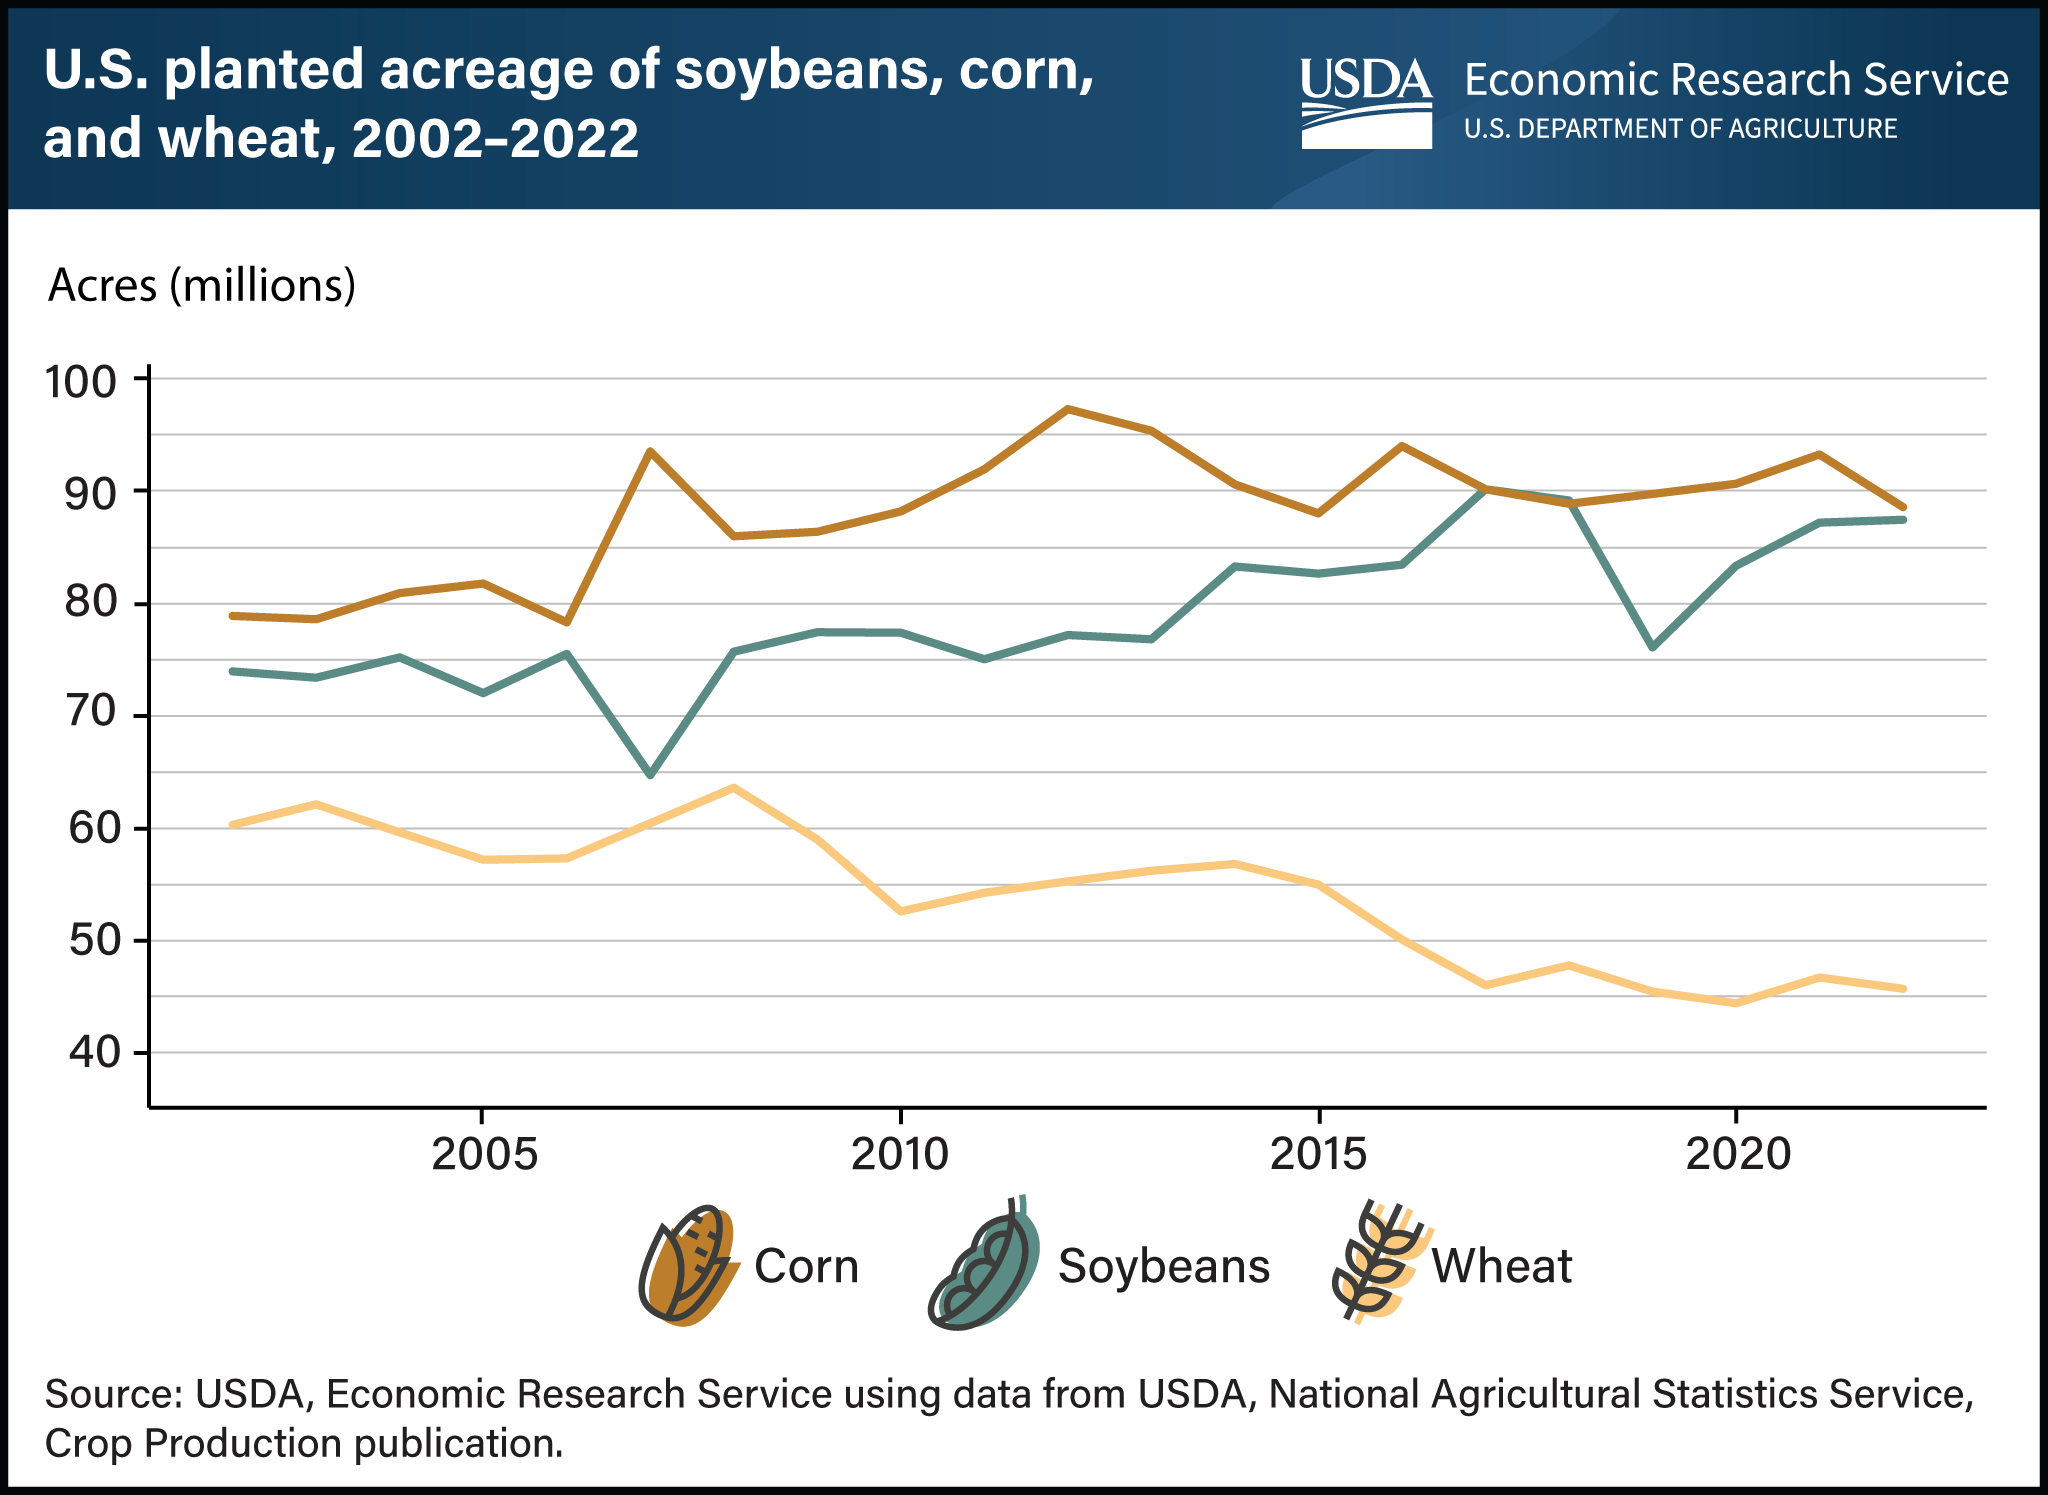
Between 2002 and 2022, soybeans were the second-most planted crop in the United States, behind corn. The exception was in 2018 when acreage planted to soybeans surpassed corn. While the total acres planted to soybeans generally have been less than to corn, the rate of growth in soybean sowings has exceeded corn since the early 2000s. Soybean planted acreage grew by 18 percent, from 74 million in 2002 to 87 million in 2022, while corn planted acreage increased by 12 percent in the same period. In contrast to this growth, wheat planted acres declined 22 percent over the same 20-year period—with some wheat acres shifting into soybeans. While net gains in soybean acres planted have been sizable, growth over the past two decades has not been steady. From 2002 to 2006, gains were modest, followed by a sharp decline in 2007 when biofuel policy increased the demand and price for corn. Increased profitability for corn shifted many acres out of soybeans and into corn production. After 2007, and for the next several years, generally improving profit margins reinvigorated soybean plantings, which continued their upward trajectory, peaking in 2017 at 90 million acres. Acreage fell slightly in 2018 and more sharply in 2019 to 76 million acres—the lowest since 2011—after China’s trade restrictions reduced global demand for U.S. soybeans, which caused soybean prices to fall. Heavy spring rains in 2019 contributed further to the reduction in soybean plantings, but planted acreage partially recovered in the following years. This chart is drawn from the USDA, Economic Research Service report, Characteristics and Trends of U.S. Soybean Production Practices, Costs, and Returns Since 2002, published in June 2023.